|
Special Features


Image Libraries


|
|
Blog
Gas stations were much better looking in 1924Most gas stations these days are pretty garish, but gas stations weren’t always so. Check out this vintage 1924 station, from Connecticut Avenue in Woodley Park.
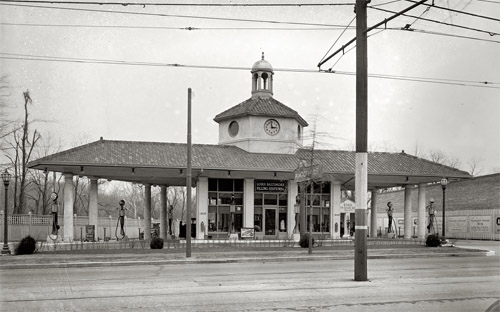
Lord Baltimore Filling Station. Photo by the National Photo Company, via the Library of Congress.
This is the Lord Baltimore Filling Station, at the corner of Connecticut Avenue and Ordway Street NW. It may not be truly typical of the era, but it’s hard to imagine seeing as sharp-looking a gas station today.
It’s not only the nice architecture that make this notable. It’s also the urban design. This isn’t as great for sidewalk life as a row of main street-style shops, but it’s a building that fronts on the sidewalk. It could be a lot worse.
Do you know of any unusually good-looking gas stations? What makes them interesting?
 Cross-posted at Greater Greater Washington. Cross-posted at Greater Greater Washington.
April 6th, 2015 | Permalink
Tags: architecture, history, roads/cars, urbandesign

Australia has an enormous nationwide beltwayWashington’s I-495 beltway is a 64 mile long loop. London’s M-25 orbital motorway is 117 miles. They seem big, but they’re practically microscopic next to the greatest ring road on Earth, Australia’s 9,000-mile Highway 1.
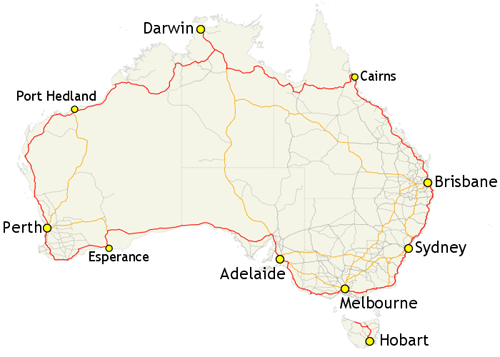
Map from the Commonwealth of Australia.
In fact, Highway 1 is the longest single highway in the world. It’s 32% longer than Russia’s Trans-Siberian Highway, and almost three times longer than the longest US Interstate, I-90.
The Australian government created Highway 1 in 1955, by compiling a network of existing local and regional highways under a single banner.
Unlike American Interstates, Highway 1 isn’t fully limited access for its entire length. Near big cities like Sydney or Melbourne it looks like an Interstate, but many sections in rural areas are simple two-lane roads, and some extremely isolated sections are even more basic.
All hail the king of ring roads.
Cross-posted at Greater Greater Washington.
January 12th, 2015 | Permalink
Tags: fun, maps, roads/cars, transportation
How fast can you go? Map of maximum speed limits around the worldIn most of the United States, the maximum speed limit is somewhere between 65 and 75 miles per hour. What about the rest of the world? This map tells you.
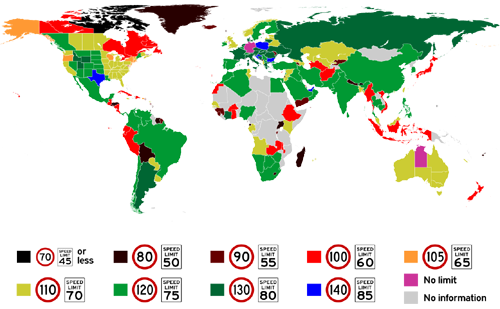
Maximum speed limits around the world. Map from Reddit user worldbeyondyourown.
In the eastern US, most states top out with maximum speed limits of 70 miles per hour. Out west, most states allow 75, and a handful go even higher than that.
Texas has the highest speed limit in the western hemisphere, at 85 miles per hour. On the other end of the spectrum, no road in Canada’s province Nunavut has a limit above 45 miles per hour.
Germany’s Autobahn famously has no maximum speed limit, but it’s not the only place in the world to hold that distinction. Australia’s Northern Territory is also speed limit free. But don’t try racing down roads in Bhutan, where the maximum limit is no higher than 45.
What else jumps out?
Cross-posted at Greater Greater Washington.
December 11th, 2014 | Permalink
Tags: maps, roads/cars, transportation
Does Maryland’s statewide planning make big projects harder to build?
|

Maryland Governor’s Mansion. Image from the Boston Public Library on Flickr. |
Despite years of work and broad community support to build the Purple Line, Maryland’s new Republican governor-elect may kill the project. Does Maryland’s heavily centralized state-level planning make it particularly susceptible to shifts like this one?
Most US states delegate transit planning to regional or municipal agencies, rather than doing it at the state level. Maryland is unusual. It’s geographically small and dominated by urban areas, and it has a history of governors interested in planning. So the state handles much more planning than usual, especially for transit.
That can be a mixed blessing.
When things go well, it means Maryland directs many more resources to transit than most other states. But it also means transit projects in Maryland are inherently more vulnerable to outside politics.
Maryland’s centralized system is designed under the assumption that Democrats will always control the state government, and therefore planning priorities won’t change very much from election to election. Were that actually the case, the system would work pretty well.
But recent history shows Maryland is not nearly so safe as Democrats might hope. With Larry Hogan’s election, two out of the last three Maryland governors have been Republicans. And they have different priorities.
Of course, it’s completely proper for political victors to have their own priorities. We live in a representative democracy, and we want it that way.
But shifting priorities are a big problem for any large infrastructure projects that take more than one governor’s time in office to complete.
It takes at least 10 years to plan and build something like a light rail line, or a new highway. If every new governor starts over, the project never gets done.
Thus, large infrastructure projects like the Purple Line, Baltimore’s light rail, and even highways like the ICC wallow in uncertainty for decades, shifting back and forth as one governor’s pet project and another governor’s whipping post.
Maryland’s spent literally half a century debating and re-debating whether or not to build the ICC highway.
While many states centralize their planning for highways, so much money automatically flows towards highway expansion that a lot of big road projects inevitably sail through without becoming political issues. Since transit rarely has dedicated funding for long term expansion, transit projects are more likely to become politicized.
And although this problem can happen anywhere, Maryland’s particular system centralizing transit planning under the governor’s office seems to make it par for the course.
When regional or local agencies control more of the planning, they’re less susceptible to the whims of any individual election.
For example on the southern side of the Potomac, where Virginia kept Silver Line planning alive through multiple Democrat and Republican governors, but only managed to actually build it after the Metropolitan Washington Airports Authority took over ownership of the project from the state in 2007. After that, the state was involved but not the leader, making the project less of a target for governors or legislators.
Is there a best of both worlds?
The benefit to statewide planning is statewide resources. The Maryland Department of Transportation is much more willing to spend its own money on transit than almost any other state DOT.
While Fairfax County and MWAA had to increase local commercial property taxes and tolls in the Dulles Corridor to build the Silver Line, MDOT leadership meant Montgomery and Prince George’s weren’t supposed to need such schemes for the Purple Line.
Could we find a way to preserve access to the state’s financial resources without putting urban transportation projects at the mercy of voters on the Eastern Shore? Maybe.
Virginia offers a compelling model, with its regional planning agencies like the Northern Virginia Transportation Authority. NVTA makes decisions and receives funding at the metropolitan level, and is governed by a relatively stable board rather than one single politician.
Naturally the NVTA system has trade-offs too. For example, NVTA has independent funding streams but doesn’t get to allocate VDOT money. And NVTA is ultimately under jurisdiction of the Virginia General Assembly, which can impose its will any time.
No system is ever perfect, and Maryland wouldn’t have to copy Virginia directly. But something similar in concept might work, especially if it combined regional decision-making with state funding.
Don’t mistake Maryland’s problem as a criticism of planning in general
One common trope among some sprawl apologists and highway lobbyists is that central planning is inherently bad. For them, “central planning” is a code word that really means smart growth and transit planning in general.
Maryland’s reliance on statewide rather than regional-level planning does not prove those pundits right. Without government planning no large infrastructure projects would be possible at all.
Maryland has a specific problem with how it implements its planning, which leaders in the state can practically address without throwing the planning baby out with the bathwater.
Perhaps it’s time to begin that conversation.
Cross-posted at Greater Greater Washington.
November 7th, 2014 | Permalink
Tags: government, lightrail, proposal, roads/cars, transportation
Gas is suddenly cheap(er), and the reason is bigger than you think
|
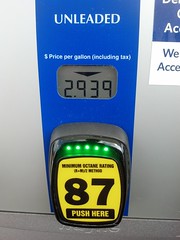
Photo by Wil C. Fry on Flickr. |
Gas prices have fallen below $3 per gallon in much of the US, and the explanation isn’t the simple seasonal differences that always make gas cheaper in autumn. The bigger reason: US oil shale deposits are turning the global oil market on its head.
How did cheap gas happen?
In the simplest terms, supply is up and demand is down.
Travel drops between the summer travel season and the holidays, and cooler fall temperatures actually make gas cheaper to produce. That’s why gas prices always fall in autumn.
But that’s not enough to explain this autumn’s decline, since gas hasn’t dropped this low in years. China is also using less gas than expected, but that’s also only part of the explanation.
The bigger explanation seems to be that supply is also up, in a huge way. North American oil shale is hitting the market like never before, and it’s totally unbalancing the global oil market. Oil shale has become so cheap, and North American shale producers are making such a dent in traditional crude, that some prognosticators are proclaiming that “OPEC is over.”
It’s that serious a shift in the market.
Will this last?
Yes and no.
The annual fall price drop will end by Thanksgiving, just like it always does. Next summer, prices will rise just like they always do. Those dynamics haven’t changed at all.
Likewise, gasoline demand in China and the rest of the developing world will certainly continue to grow. Whether it outpaces or under-performs predictions matters less in the long term than the fact that it will keep rising. That hasn’t changed either.
But the supply issue has definitely changed. Oil shale is here to stay, at least for a while. Oil shale production might keep rising or it might stabilize, but either way OPEC crude is no longer the only game in town.
Of course, oil shale herf=”http://www.businessweek.com/articles/2013-10-10/u-dot-s-dot-shale-oil-boom-may-not-last-as-fracking-wells-lack-staying-power”>isn’t limitless. Eventually shale will hit peak production just like crude did. When that happens it will inevitably become more expensive as we use up the easy to refine reserves and have to fall back on more expensive sources. That’s a mathematical certainty. But it’s not going to happen tomorrow. In the meantime, oil shale isn’t very scarce.
So the bottom line is that demand will go back up in a matter of weeks, and the supply will probably stabilize, but at higher levels than before.
What does this mean?
Here’s what it doesn’t mean: There’s never going to be another 1990s bonanza of $1/gallon fill-ups. Gas will be cheaper than it was in 2013, but the 20th Century gravy train of truly cheap oil is over.
Oil shale costs more to extract and refine than crude oil. Prices have to be high simply to make refining oil shale worth the cost, which is why we’ve only recently started refining it at large scales. Shale wouldn’t be profitable if prices dropped to 1990s levels. In that sense, oil shale is sort of like HOT lanes on a congested highway, which only provide benefits if the main road remains congested.
So shale can only take gas prices down to a little below current levels. And eventually increased demand will inevitably overwhelm the new supply. How long that will take is anybody’s guess.
In the ultimate long term, oil shale doesn’t change most of the big questions surrounding sustainable energy. Prices are still going to rise, except for occasional blips. We still need better sustainable alternatives. Fossil fuels are still wreaking environmental catastrophe, and the fracking process that’s necessary to produce oil shale is particularly bad. It would be foolish in the extreme for our civilization to abandon the progress we’ve made on those fronts, and go back to the SUV culture of the 20th Century.
There will probably be lasting effects on OPEC economies. The geopolitical situation could become more interesting.
In the meantime, enjoy the windfall.
Cross-posted at Greater Greater Washington.
October 28th, 2014 | Permalink
Tags: economy, energy, environment, roads/cars, transportation
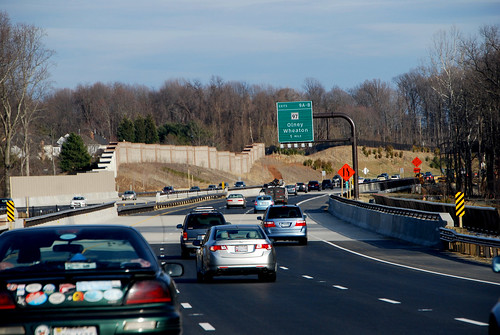
Eight-car Metro trains equal widening I-66 by 2-4 lanesLengthening all Metrorail trains to 8 cars long would add as much capacity to the I-66 corridor as widening the highway by two to four lanes.
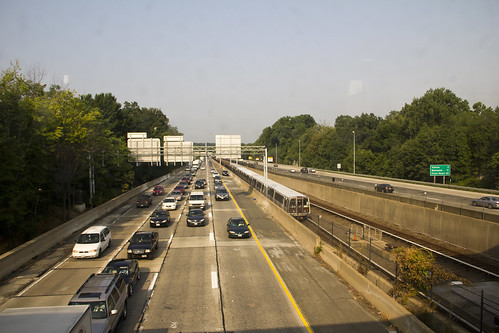
I-66. Photo from Bossi on Flickr.
If Metro lengthened all trains to 8 railcars, it would increase capacity on the Orange/Silver Line through Arlington by 4,740 passengers per hour per direction. Comparatively, one new highway lane would be able to carry 2,200 cars per hour.
Even assuming two passengers per car (likely higher than the real average), a new highway lane would only carry 4,400 passengers per hour. Still fewer than 8-car Metro trains.
Then, to account for the reverse direction, double all calculations. Bidirectional Metrorail capacity would increase by 9,480 passengers per hour, equivalent to 4.3 lanes full of single-occupant cars, or 2.15 lanes full of cars with two passengers each.
Eight-car trains would also be cheaper and carry passengers faster than equivalent new highway capacity, according to WMATA’s PlanItMetro blog.
Clearly it’s time to think longer, not wider.
Cross-posted at Greater Greater Washington.
July 15th, 2014 | Permalink
Tags: metrorail, roads/cars, transportation
MoveDC plan proposes more cycletracks, transit, and tolls. Will it actually happen?The latest draft of DDOT’s citywide transportation plan, moveDC, calls for a massive expansion of transit and cycling facilities throughout the District, plus new tolls on car commuters. If the District adopts it, the plan will become one of America’s most progressive.

The moveDC plan summary map. All images from DDOT.
DDOT released the latest version of moveDC last Friday, launching a month long public comment period in anticipation of a DC Council hearing on June 27. Following that, the mayor will determine any changes based on the comment period, with final adoption anticipated this summer.
What’s in the plan
Amid the hundreds of specific recommendations in the plan, three major proposed initiatives stand out:
- A vastly improved transit network, with 69 miles of streetcars, transit lanes, and improved buses, plus a new Metrorail subway downtown.
- A massive increase in new cycling infrastructure, including the densest network of cycletracks this side of Europe.
- Congestion pricing for cars entering downtown, and traveling on some of DC’s biggest highways.
Transit

Proposed high-capacity transit network (both streetcars and bus). Blue is mixed-traffic, red is dedicated transit lanes.
The plan proposes to finish DC’s 22-mile streetcar system, then implement a further 47-mile high-capacity transit network that could use a combination of streetcars or buses. That includes 25 miles of dedicated transit lanes, including the much requested 16th Street bus lane.
Although the proposed high capacity transit corridors closely mirror the 37-mile streetcar network originally charted in 2010, there are several new corridors. In addition to 16th Street, moveDC shows routes on Wisconsin Avenue, both North and South Capitol Streets, H and I Streets downtown, and several tweaks and extensions to other corridors.
The plan endorses WMATA’s idea for a new loop subway through downtown DC, but explicitly denies that DC can fund that project alone.
MoveDC also shows a network of new high-frequency local bus routes, including Connecticut Avenue, Military Road, Alabama Avenue, and MacArthur Boulevard.
Bicycles
MoveDC also includes a huge expansion of trails and bike lanes, especially cycletracks.

Proposed bike network. The pink lines are cycletracks.
Under the plan, DC would have a whopping 72 miles of cycletracks crisscrossing all over the city. From South Dakota Avenue to Arizona Avenue to Mississippi Avenue, everybody gets a cycletrack.
Meanwhile, moveDC shows major new off-street trails along Massachusetts Avenue, New York Avenue, and the Anacostia Freeway, among others.
Tolls for cars
Congestion pricing is clearly on DDOT’s mind, with multiple proposals for new variable tolls in the plan.

Proposed downtown cordon charge zone.
The most aggressive proposal is to a declare a cordon charge to enter downtown in a car. This idea has worked in London and has been discussed in New York and San Francisco, but so far no American city has tried it.
Meanwhile, some of the major car routes into DC would also be converted to managed lanes. Like Maryland’s ICC or Virginia’s Beltway HOT lanes, managed lanes have variable tolls that rise or fall based on how busy a road is.
MoveDC proposes managed lanes on I-395, I-295, New York Avenue, and Canal Road.
What will the council think?
DDOT has produced a very strong plan, but is it going anywhere? The DC Council will discuss moveDC on June 27, at which time we’ll find out if the same people who pulled the rug out from under streetcar funding are interested in progressive policy-making, at least.
Even if DC does adopt this plan, whether the council will actually provide the funds necessary to build it is anybody’s guess.
Correction: An earlier version of this story reported the DC Council will approve or deny this plan. Authority to approve it actually rests solely with the mayor.
Cross-posted at Greater Greater Washington.
June 2nd, 2014 | Permalink
Tags: bike, BRT, bus, government, lightrail, master planning, metrorail, roads/cars, streetcar, transportation
Why a bus lane might help cars too, in one simple pictureThis is what 16th Street looks like on a typical weekday morning. Good luck navigating it, as either a bus rider or car driver.
Streamlining this mess of buses with a transit lane could speed up traffic for everyone.
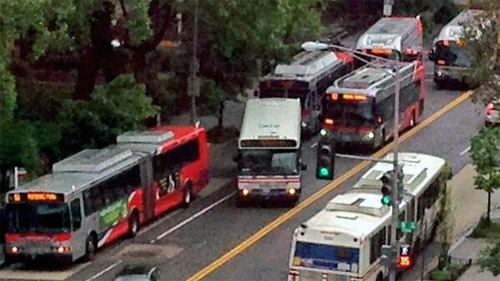
Bus bunching on 16th Street. Photo by Kishan Putta.
More than half of all people traveling on 16th Street at rush hour use the bus. It’s DC’s most successful bus corridor. But that success comes with a down side: There are so many buses that they bunch into bus traffic jams.
That’s a problem for both bus riders and car drivers. Instead of being able to catch a bus every two minutes, transit riders have to wait a long time for a clump of several buses to arrive all together, almost like a single long train. Most of the buses are full, but eventually one near the end of the “train” may have enough room for more passengers to board.
That’s inefficient, slows down the line, reduces overall capacity, and adds unnecessary operating expense.
And it’s just as bad for car drivers. Imagine being stuck behind that clump of buses in a car. That’s a traffic jam, no two ways about it.
And this is why a bus lane on 16th Street could potentially help everyone. If that bus traffic jam can be streamlined into a bus lane, buses will move faster and stay better organized, and cars won’t have to contend with roaming clumps of disorganized buses spilling into every lane.
Theoretically DDOT should be able to add a bus lane without sacrificing any car lanes. But even if sacrificing a car lane is necessary, that still may improve car traffic simply by virtue of eliminating bus jams.
It’s worth trying.
Cross-posted at Greater Greater Washington.
May 1st, 2014 | Permalink
Tags: BRT, bus, roads/cars, transportation
Fairfax’s answer to neighbors’ transit plans: Light rail, streetcars, and BRTNot to be outdone by its neighbors’ aggressive plans for rail and BRT networks, Fairfax County has an impressive transit plan of its own.
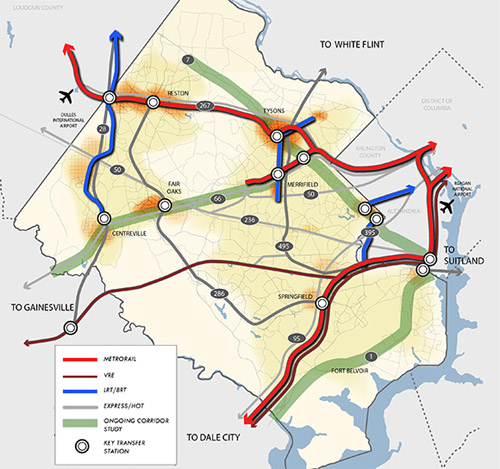
Fairfax County’s proposed high quality transit network. Image from Fairfax.
DC has its streetcar and moveDC plans, Arlington and Alexandria have streetcars and BRT, and Montgomery has its expansive BRT network, plus of course the Purple Line.
Now Fairfax has a major countrywide transit plan too, called the High Quality Transit Network.
Fairfax’s top priorities are to finish the Silver Line and the Bailey’s Crossroads portion of the Columbia Pike streetcar, but that’s not the end of their plans.
County planners are also looking at several other corridors, including Route 1, Route 7 (both east and west of Tysons), I-66, Route 28, and Gallows Road/Dolly Madison Boulevard.
Both rail and BRT are possibilities for all those corridors. Some may end up light rail or streetcar, others bus. Route 1 and I-66 could even include Metrorail extensions.
In addition to all that, Fairfax County Parkway is slated for HOT lanes, which could make express buses a more practical option there.
As the DC region continues to grow, and demand for walkable, transit-accessible communities continues to increase, these types of plans are crucial. If our major arterial highways are going to become the mixed-use main streets of tomorrow, transit on them must significantly improve.
Fairfax is undeniably still spending a lot on bigger highways. Planners’ inability to calm traffic on Routes 7 and 123 through Tysons, for example, indicates roads are still priority number one. But it takes a plan to change, and this is a strong step forward. So good on Fairfax for joining the club.
Cross-posted at Greater Greater Washington.
April 22nd, 2014 | Permalink
Tags: BRT, land use, lightrail, master planning, metrorail, roads/cars, streetcar, transportation
Sneckdowns take over the streetsThe recent snow made for the best sneckdown spotting weather in DC since the term first entered our lexicon. Last week we put out a call for photos of sneckdowns in the wild, and plenty of you responded. Here are some of the best.

17th and Potomac Ave, SE. Photo by Justin Antos.
In the wonky world of urbanism advocacy, sneckdowns have gone viral. The term, referring to places where snow formations show street spaces cars don’t use, first popped up in New York. Since then it’s made headlines in Philadelphia, Chicago, Vancouver, and more.
It’s true that actual engineers shouldn’t design streets solely around piled snow, but certainly sneckdowns are a handy illustration of how we give too much pavement to cars.
Here are more local examples, sent in by readers.

14th St and Independence Ave, SW. Photo by @gregbilling.

M St and Jefferson St, NW. Photo by @gregbilling.

Rhode Island Ave and R St, NW. Photo by @MaryLauran.

Rhode Island Ave and Q St, NW. Photo by @MaryLauran.

4th St, NE. Photo by @TonyTGoodman.

Fairfax Dr and 10th St N, in Arlington. Photo by @guusbosman.

Greenbelt. Photo by msickle.
Thanks to everyone who sent in photos! Keep watching #dcsneckdown on Twitter for more.
Cross-posted at Greater Greater Washington.
February 18th, 2014 | Permalink
Tags: environment, roads/cars, transportation, urbandesign
|
Media


Site
About BeyondDC
Archive 2003-06
Contact
Category Tags:
Partners
|


_map.png)


