|
Special Features
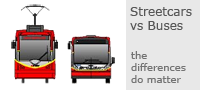


Image Libraries


|
|
Blog
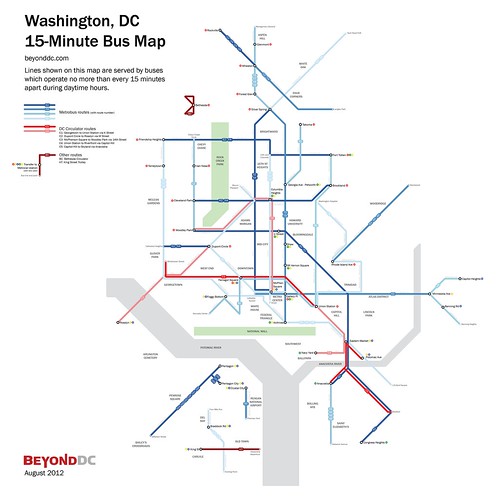
Back in 2010, WMATA produced a 15-minute bus map that showed bus routes with frequent service throughout the day. That map was just for planning purposes, but it’s such a useful idea that I took the next step, and turned it into a more user-friendly diagram.
In addition to Metrobus routes, this map also shows other frequent bus services in the region, including DC Circulator, Bethesda Circulator, and the King Street Trolley.
 Cross-posted at Greater Greater Washington. Cross-posted at Greater Greater Washington.
Average Rating: 4.4 out of 5 based on 163 user reviews.
August 10th, 2012 | Permalink
Tags: bus, featured post, maps, transportation

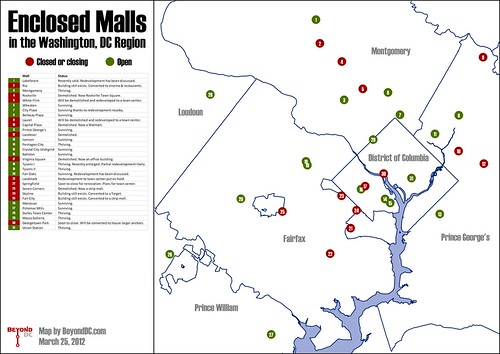
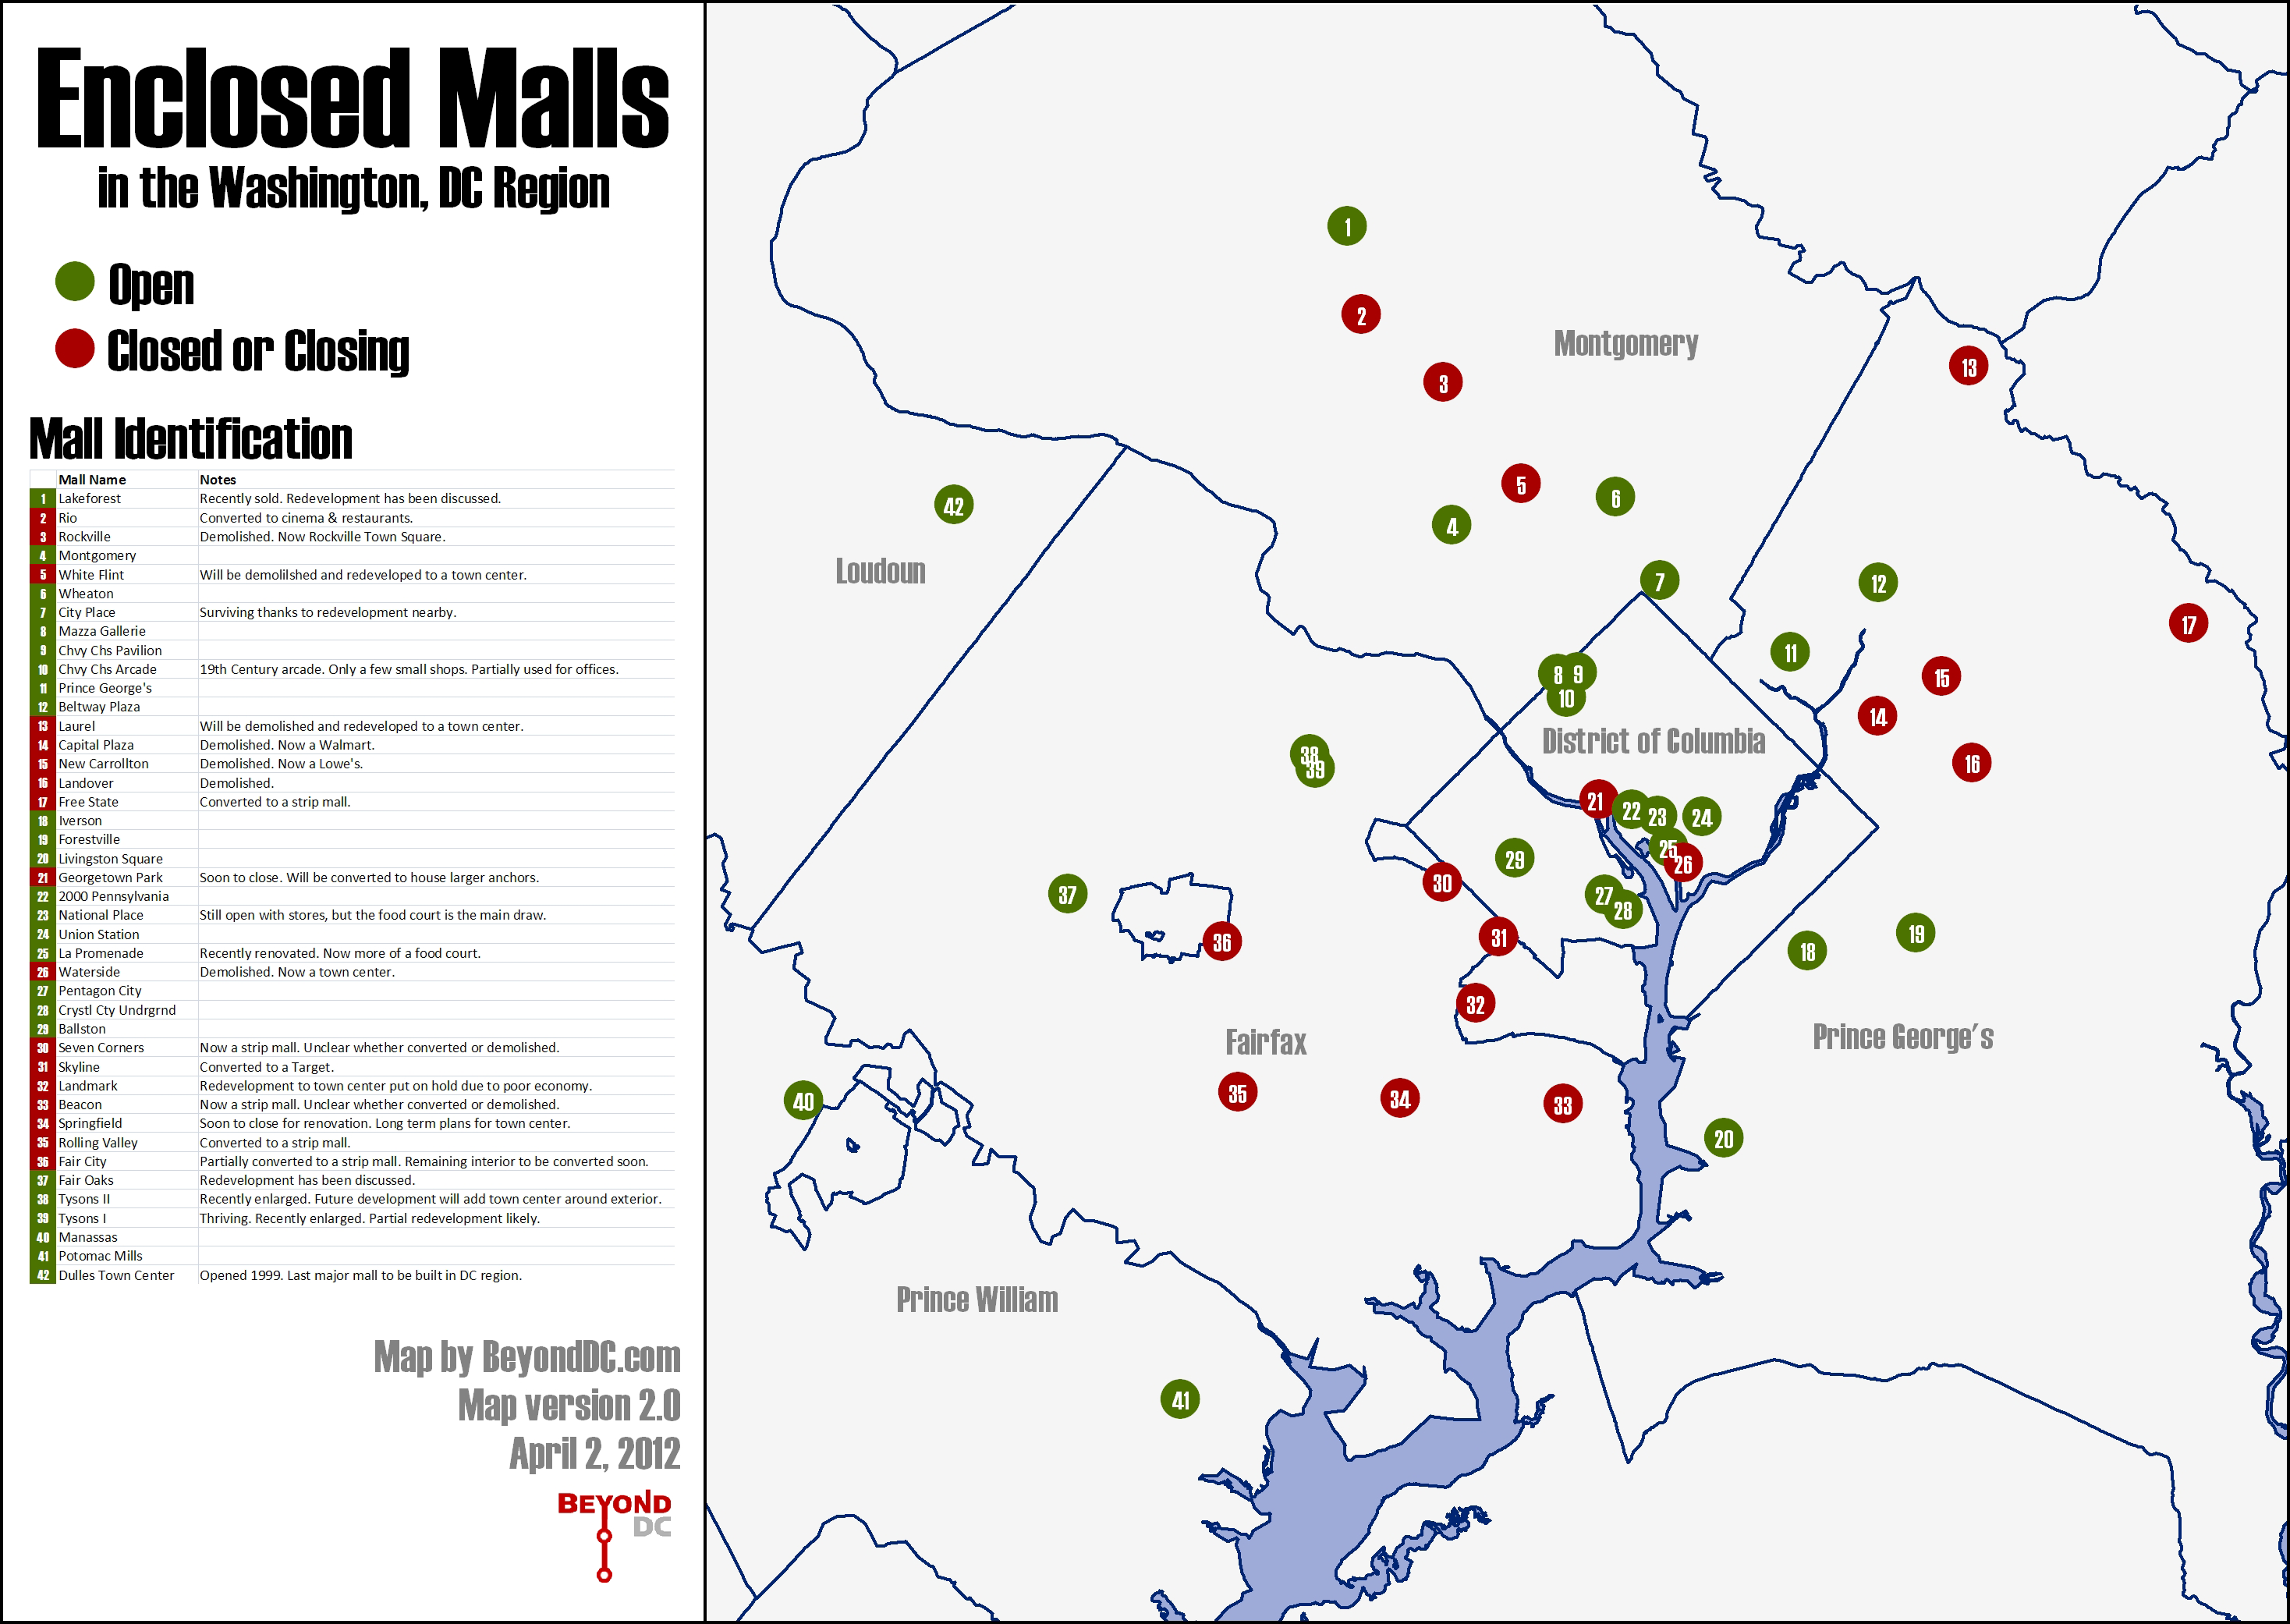
I got a lot of useful comments on the closed mall map posted last week, both here and in the GGW thread. I’ve incorporated them into a second, improved draft.
The new & improved map.
The comments generally fell into two categories: questions about the definitions, and malls that should be added to the map.
Definitions:
For the purposes of this map, an “enclosed mall” is defined as a shopping center in which there is a row of small retail shops that are primarily accessed by pedestrians via an interior walkway. The two key components are small shops and an interior walkway. Buildings with interior spaces that consist primarily of large format retailers (such as the Pentagon Centre or DCUSA) are not malls for my purposes. Neither are spaces that are primarily food courts. Basically, to qualify as a mall for this map, a shopping center should have a space that looks generally like this.
Additions and subtractions:
This second draft includes the following malls that were left out of the first: La Promenade (DC), Waterside (DC), Free State (Bowie), Livingston (Ft Washington), Chevy Chase Pavilion (DC), National Place (DC), Beacon Mall (Mount Vernon), 2000 Pennsylvania Ave (DC), New Carrollton Mall (New Carrollton), Centre at Forestville (Forestville), Rolling Valley Mall (Burke).
The only mall subtracted from the original map was Virginia Square, which had a department store but apparently never an enclosed row of smaller shops.
I removed references to “thriving” and “surviving” from the table in the legend, since that was subjective and unclear.
Notable omissions:
Shopping centers that could be considered malls but that don’t meet the definition I used for this map include DCUSA, Old Post Office Pavilion, Gallery Place, Pentagon Centre, and the terminals at National and Dulles airports. The airports might technically meet the definition, but they’re obviously a different animal.
Average Rating: 4.9 out of 5 based on 286 user reviews.
April 2nd, 2012 | Permalink
Tags: featured post, The New America
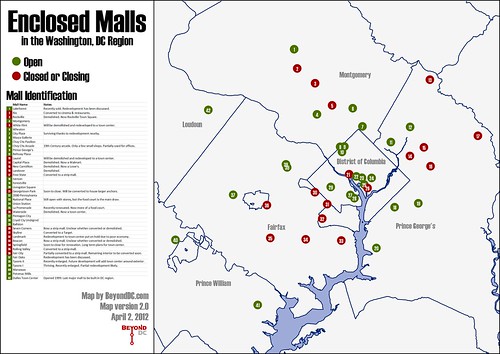
Once the economic juggernaut of suburbia, enclosed malls are slowly dying all across America. The Washington region is no exception.
This map shows 31 enclosed malls in the DC area, color-coded by status: green for malls that are still open, and red for malls that are closed or in the process of closing.
The 31 malls on the map range from small local ones like Fair City in Fairfax, to gargantuan super-regional ones like Tysons Corner. The only requirement to be on the map is that malls contain a common interior hallway lined with several shops.
Some, like Pentagon City, are chugging along as healthily as ever. Others, like Seven Corners Center, have been gone for years. Overall, more than 40% of the dots are red.
The reasons malls have closed vary as much as the malls themselves. Some closed because they were housed in cheap buildings that simply reached the end of their intended lifespans, while others couldn’t compete with the mixed-use town center developments that have become common in recent years.
Geography seems to be unimportant in whether a mall lives or dies. Red dots permeate all corners of the map, regardless of the wealth of the jurisdiction.
One thing that does seem to make a difference is size. Larger malls that draw from a wider area generally seem more likely to thrive than smaller ones. As the years go by and even more green dots turn to red, it’s likely the last hold outs will be the biggest and most famous.
Is this map comprehensive? Did I miss any malls? Let me know in the comments.
Cross-posted at Greater Greater Washington.
Average Rating: 4.4 out of 5 based on 201 user reviews.
March 27th, 2012 | Permalink
Tags: featured post, The New America
All these Capital Bikeshare expansions are getting confusing. BeyondDC discussed expansion earlier this week, but that post is already obsolete since DDOT’s Wednesday announcement that it is funding 50 new stations in addition to the 30-some already under way.
Let’s take this opportunity to record the history and near future of expansion, in a nice clear table.
I’ll try to update this list whenever new information becomes available, and will add a link to it in the “Features” menu on the BeyondDC home page (left side of the screen) so it always easy to find.
| Location |
Stations |
Date |
Official Link |
| Original System |
| Arlington – Crystal City |
14 |
Sept 2010 |
|
| DC |
100 |
Sept 2010 – Feb 2011 |
|
| Completed Expansions |
| Arlington – Rosslyn |
4 |
April 2011 |
|
| Funded Future Expansions |
| DC – first expansion |
34* |
Fall 2011 |
Link |
| Arlington – Rosslyn-Ballston corridor |
33* |
Late 2011 |
Link |
| DC – second expansion |
50 |
Early 2012 |
Link |
| Rockville |
20 |
Sometime 2012 |
Link |
| Alexandria |
6** |
Sometime 2012 |
N/a |
| Total Funded System |
| Regional |
261 |
2012 |
|
* The DC and Arlington 2011 expansions have generally been reported as being “around 25 and 30 stations” respectively. I came up with 34 and 33 stations by counting the proposed locations shown on the linked maps.
** Apparently Alexandria’s participation is still somewhat up in the air. They have tentatively funded 6 stations, but may still move the funding elsewhere.
Average Rating: 4.7 out of 5 based on 238 user reviews.
September 23rd, 2011 | Permalink
Tags: bike, featured post, transportation
As urban cycling becomes more common, new terms are entering the lexicon that people may not be completely familiar with. This post will provide a guide to the most common types of urban bikeways.
There are seven basic types of bicycle travelways. In increasing order of separation quality, they are:
Mixed traffic
 |
|
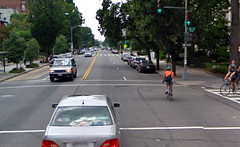
Mixed traffic bikeways are simply regular streets on which bikes are permitted to mix with cars. Almost every street in existence qualifies, except those with dedicated bike facilities, or the few where bikes are specifically outlawed. Many jurisdictions designate some streets as “suggested bike routes, ” which are mixed traffic streets that are deemed to be inherently bike-friendly, but where no (or limited) special treatments have been applied. Arlington’s bike map provides a good example: white-colored streets are normal roads, while blue-colored streets are suggested bike routes. Both white and blue qualify as mixed-traffic bikeways. Some cyclists prefer to ride in mixed traffic rather than on dedicated facilities. Photo by Google. |
Sharrow street
 |
|
Sharrow streets are mixed traffic roads on which graphics have been applied to the roadway indicating that cars and bikes should share the full lane as equals. Sharrows notify cars that they should expect bicycles on a street, and indicate to bicyclists that is safe to ride in the center of the street rather than on the sidewalk or in the door zone. They are the minimum bike-specific infrastructure for streets. Photo by Eric Gilliland. |
Bike lane
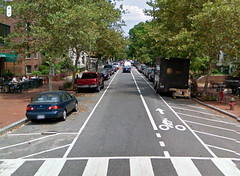 |
|
Bike lanes are the most common type of bike-specific infrastructure in most cities. They are lanes painted onto a street that are designated for use by bicycles, but which are not physically protected from lanes used by cars. Most bike lanes are located on the extreme right of the through part of the street, but to the left of the parking lane or right-turn lane (if they are present). The most common type of bike lane is designated with white paint as shown in the picture, however some jurisdictions take the extra step of painting them green or blue at key locations in order to increase visibility. Another modification to the standard bike line is to add a painted buffer that increases the separation between bikes and cars. Painted or buffered bike lanes may be considered “enhanced.” On high-speed roadways shoulders are often used as minimal bike lanes. Photo by Google. |
Bike boulevard
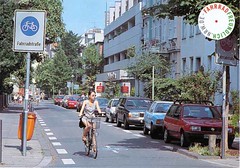 |
|
Bike boulevards are streets specifically optimized for bikes through a variety of techniques, but on which cars are also permitted (though sometimes discouraged) to operate in mixed traffic. Optimization techniques are not standardized, but may include lane markings, chicanes (and other traffic calming measures), car access restrictions, bike-optimized intersection treatments, and any number of other potential enhancements. Although bike boulevards are technically mixed traffic streets, the degree of extra bike-specific infrastructure is considerably greater than on sharrow streets. As far as BeyondDC is aware, there are not currently any bike boulevards in the DC area, although Arlington is considering two parallel to Columbia Pike. Photo by “Fahrradstrasse – Radfaher sind hier tonangebend”. |
Sidepath
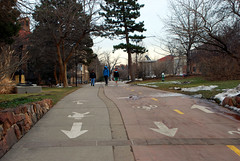 |
|
Sidepaths are off-street bikeways that are built as extensions of the sidewalk. They provide complete physical separation from cars except at intersections with cross streets. Some sidepaths are shared with pedestrians, while others designate separation from pedestrians using paint or unique paving materials. Those that do are sometimes referred to as a subset of cycle tracks since they are intended to be exclusive to bikes, but they have a lesser degree of separation from pedestrians than true cycle tracks. Photo by BeyondDC. |
Cycle track
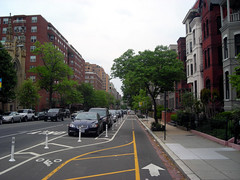 |
|
In North American usage, cycle tracks are bikeways that are completely exclusive to bikes, physically separated from all other modes. The most common form is as an on-street bike lane placed between the curb and row of parked cars, but separation can also be obtained through other means such as bollards or additional curbs. Cycle tracks can come in many shapes and sizes, and are generally considered to be the pinnacle of street-adjacent bikeways. In Europe the term is more general and can be synonymous with bike lane. Photo by BeyondDC. |
Trail / shared-use path
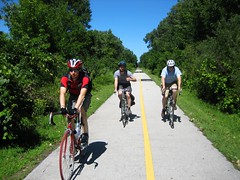 |
|
Trails are dedicated car-free travelways that follow their own unique route. They are intended to be not only off-street, but to be completely free of any interaction with cars at all. Even street crossings are intended to be extremely rare, and ideally are grade separated. Most trails are technically shared-use paths, which means pedestrians are permitted to use them as well. Nevertheless the degree of separation from cars is so desirable that trails are generally considered to be superior to cycle tracks and all other forms of bike infrastructure. Photo by TouringCyclist. |
Of course the full gamut of bicycle infrastructure includes many other types of enhancements, such as bike boxes and bike stations, but these are the seven basic types of bicycle travelways available.
Cross-posted at Greater Greater Washington.
Average Rating: 4.6 out of 5 based on 172 user reviews.
August 17th, 2011 | Permalink
Tags: bike, featured post, transportation
|
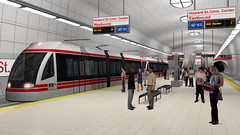
Proposed Baltimore Red Line subway station. |
With yesterday’s news that the Baltimore Red Line is being advanced to Preliminary Engineering, it seems a good time to check up on the various rail and BRT projects in the region and report on their status. I’ve ranked them below by planning category and anticipated completion, and have included Nofolk’s light rail line even though it’s outside the region.
For the purposes of this post, projects will be categorized into the following phases:
- Concept: The project is in early planning, including alternatives analysis and environmental clearance.
- Design: The project is in the engineering phase, including Preliminary Engineering (PE). Conceptual details have been finalized and detailed construction plans are being prepared.
- Construction: The project is under construction.
| Project |
Status |
Description |
Anticipated Opening |
| Norfolk ‘The Tide’ Light Rail |
Construction |
Construction is largely complete. Trains and tracks are in testing now. |
August 19, 2011 |
| H Street Streetcar |
Construction |
Streetcar running from Union Station to the Anacostia River via H Street. Under construction now. |
2012 |
| Silver Line Phase I |
Construction |
Metrorail extension from East Falls Church to Reston via Tysons Corner. Under construction now. |
2013 |
| Crystal City Potomac Yard Busway |
Design |
Exclusive busway from Crystal City Metro to Braddock Road Metro. Final design underway now. Some segments have already been constructed by private developers. |
2013 |
| Baltimore Red Line |
Design |
Light rail line running east-west through Baltimore. Recently advanced to PE from Concept. |
2016 |
| Silver Line Phase II |
Design |
Metrorail extension from Reston to Loudoun County via Dulles Airport. PE currently underway. |
2017 |
| K Street Transitway |
Design |
Exclusive transit lanes running east-west on K Street from Washington Circle to Mount Vernon Square. Environmental work completed in 2009, now awaiting funding before moving forward. |
Not published |
| Anacostia Streetcar |
Construction/Concept |
Streetcar from South Capitol Street to 11th Street bridge via Ancostia Metro. Construction of a short segment near South Capitol Street is mostly complete. The majority of the line is undergoing an alternatives analysis / environmental review that will be completed late in 2011. |
Not published |
| Benning Road Streetcar |
Concept |
Extension of the H Street Streetcar east across Anacostia River to Benning Road Metro. Alternatives analysis & environmental review to begin summer 2011. |
2015 |
| Columbia Pike Streetcar |
Concept |
Streetcar from Pentagon City to Bailey’s Crossroads via Columbia Pike. Environmental planning underway now. |
2016 |
| Potomac Yard Metro Station |
Concept |
Infill Metro station in Alexandria. Environmental planning underway now. |
2016 |
| K Street Streetcar |
Concept |
Extension of the H Street Streetcar west to Washington Circle through downtown Washington, potentially via the K Street Transitway. Alternatives analysis & environmental review to begin summer 2011. |
2018 |
| Crystal City Potomac Yard Streetcar |
Concept |
Potential conversion of CCPY busway to streetcar. Environmental planning underway. |
Not published |
| Maryland Purple Line |
Concept |
Light rail line running east-west through Maryland suburbs of DC. Concept stage largely complete. Expected to move to PE in summer or autumn 2011. |
2020 |
| Corridor Cities Transitway |
Concept |
Light rail or BRT line running north from Shady Grove Metro. Concept stage nearing completion. Mode will be determined this year. Expected to move to PE in late 2011 or 2012. |
2020 |
| DC Streetcar Other Segments |
Pre-Concept |
The rest of DC’s proposed 37 mile streetcar system. Planning has not yet begun. |
Not published |
Average Rating: 4.7 out of 5 based on 237 user reviews.
June 28th, 2011 | Permalink
Tags: BRT, featured post, lightrail, metrorail, streetcar, transportation
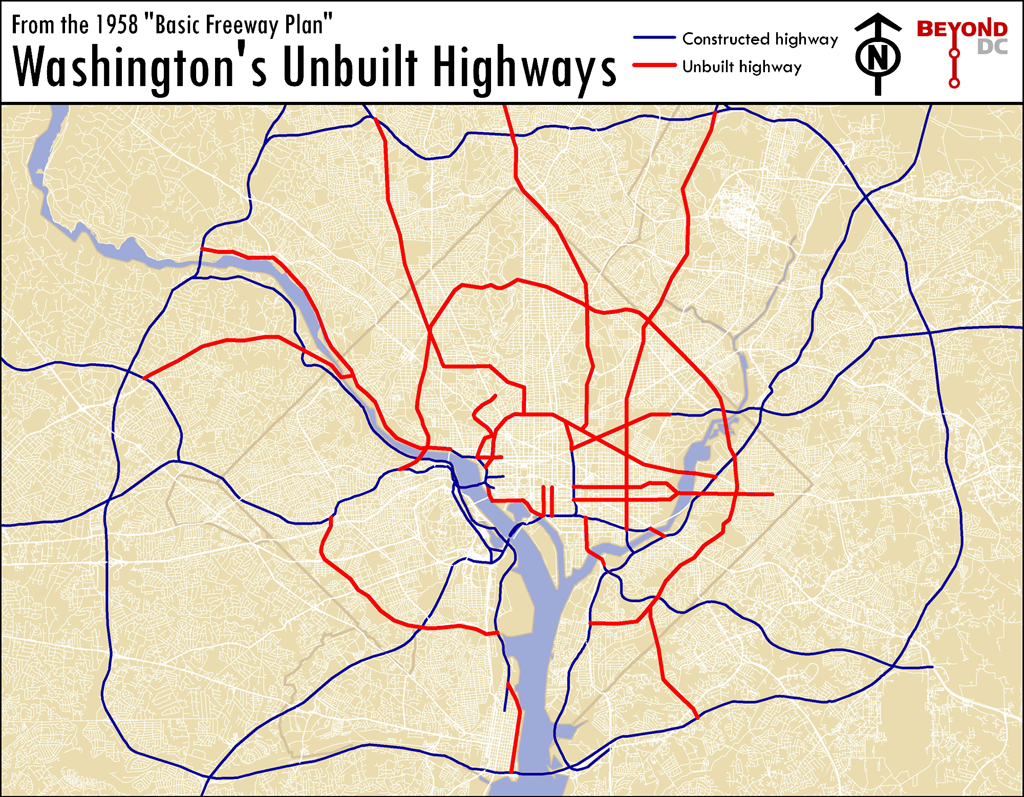
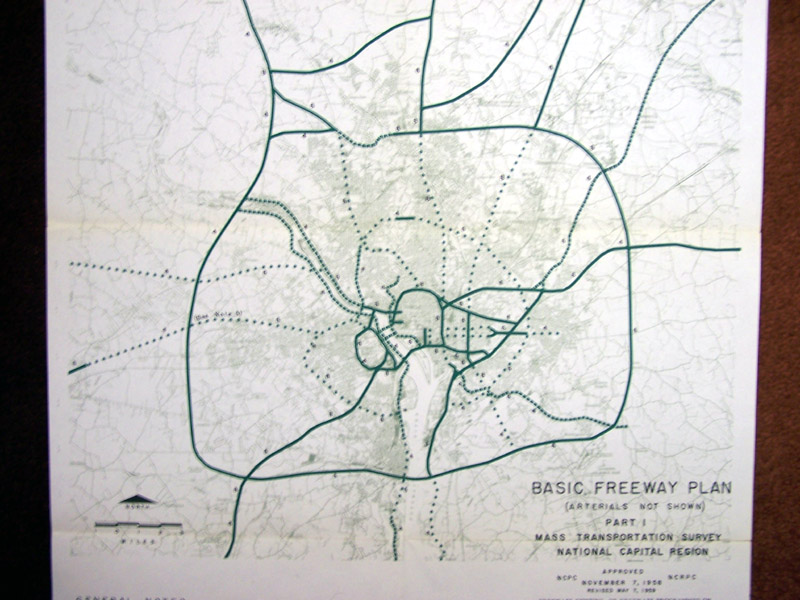
This is a map of the Washington that almost was. If mid-century planners, dedicated as they were to driving and the clearance of historic neighborhoods, had their way. It is a map of the highway network proposed for Washington during initial planning of the Eisenhower Interstate System, in 1958.
Each of these canceled highways, shown in red on the map, has its own story. Some were canceled due to civic activism, others because later proposals in the 70s preempted them, and others due to good ol’ fashioned sanity. Because they were never built, entire neighborhoods that might have been wiped out were saved, downtown was never physically cut off from its surroundings (except to the south), and millions of dollars were reallocated to construction of the Metro. Because these highways were canceled, Washington is the beautiful, walkable, vital city that we know and love today.
Most other American cities weren’t so lucky. Their highways were built, their neighborhoods demolished, and their downtowns converted to parking lots.
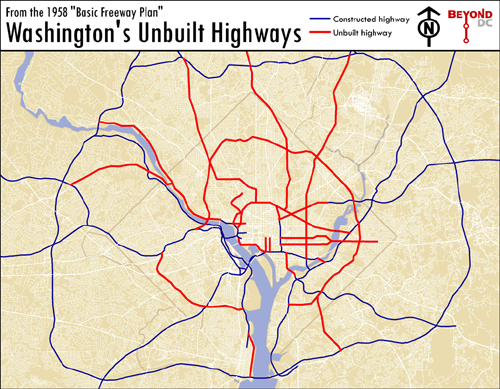
Map based on 1958 Basic Freeway Plan.
Click to enlarge.
Average Rating: 4.7 out of 5 based on 279 user reviews.
June 30th, 2010 | Permalink
Tags: featured post, history, roads/cars, transportation
Senator Lindsey Graham (R-SC) says he will vote against the climate bill he helped to write, which dramatically reduces the likelihood that Congress will be able to pass a bill to, y’know, avert global catastrophe. Ain’t partisanship super?
In honor of Mr. Graham’s decision to give the finger to future generations, here are some images from geology.com’s sea level rise mapper. At least we’ll know who gets screwed over the most.
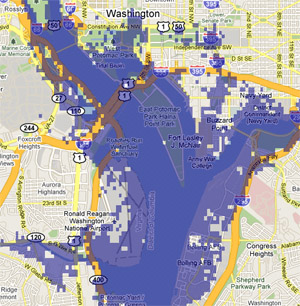
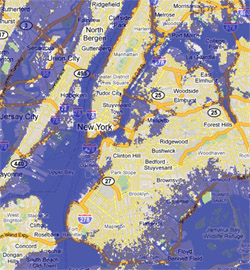
Climate scientists have so far pegged likely sea rise over the next century at somewhere between one and two meters. Here’s what a two meter rise would do to DC:
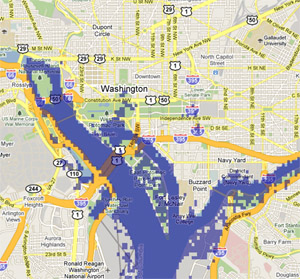
That’s not so bad. East Potomac Park is gone, some Pentagon parking lots go under, and the White House gets a reflecting pool. Hardly worth paying more for gas.
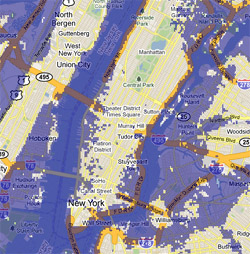
Here’s New York (left) and Ocean City (right):
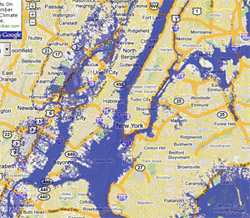 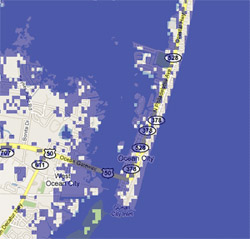
Except for some flooding around the Battery, Manhattan survives. Jersey’s Meadowlands become Meadow Bay, however, and all that’s left of Ocean City is Coastal Highway. Totally the best part.
Now New Orleans and The Netherlands:
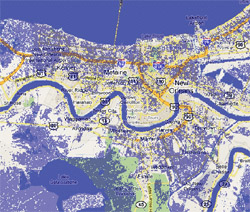 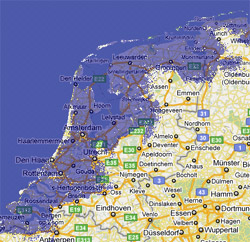
Well, nobody likes them anyway.
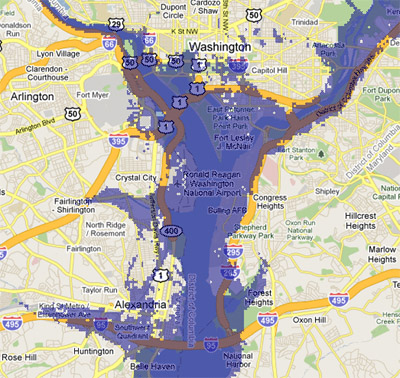
But hey, that 2-meters-in-a-century assumption is based on the slow gradual model of climate change. If something big happens, like say the Greenland ice sheet melts, we’re looking at more like a 7 meter rise. Here’s what that does to DC:
Goodbye, Southwest. Maybe we’ll get a water polo team to play in the Nationals stadium.
New York and Florida:
 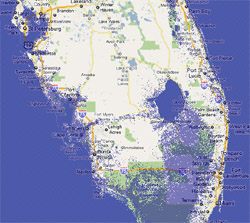
Manhattan loses a few blocks on either side, but the outer boroughs really suffer. Fort Myers and Naples are gone, but it’s kind of cool that Lake Okeechobee is a bay.
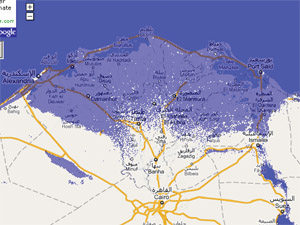
Hopefully you don’t know any of the 40 million people who call the Nile Delta home:
But you know, that’s awfully unrealistic. 7 meters from Greenland? Come on. Everybody knows that if Greenland goes, there’s a good chance West Antarctica could go too. That’s more like 12 meters. Here’s 12 meters of new Potomac:
:shrug: Sorry, Alexandria.
New York and Northern California:
 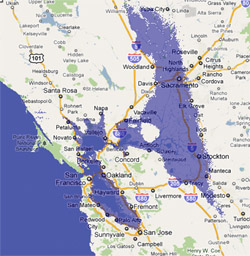
Manhattan’s rapidly losing ground now, and Brooklyn is about as big as Manhattan used to be. Most of the City of San Francisco survives, but all its suburbs are gone and Sacramento is at the bottom of a new sea.
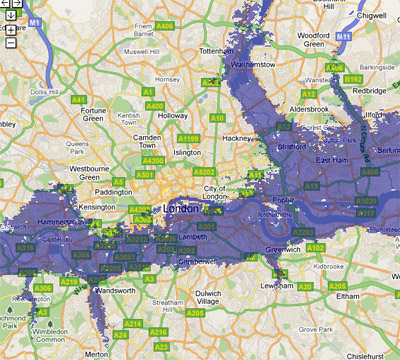
Hope nobody is too attached to central London:
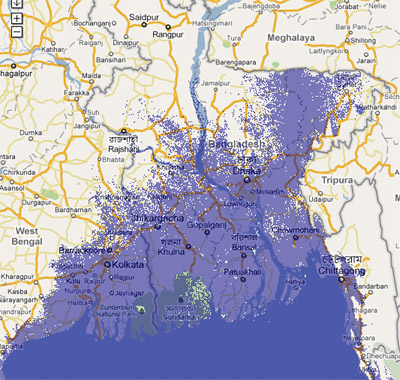
And you know what, if you’re one of the 160 million people in Bangladesh then you have only yourself to blame:
You can recreate all these maps at geology.com. It’s fun! Sort of like disaster mode on SimCity, except it’s the real world!
* Note that if this happens, Denver will be a desert. You wouldn’t want to live there either.
Average Rating: 5 out of 5 based on 279 user reviews.
June 8th, 2010 | Permalink
Tags: environment, featured post
Streetcars and buses both operate on city streets, in similar ways. So why go to the trouble and expense of building streetcars? Because there are in fact inherent differences that make one or the other better, depending on circumstances.
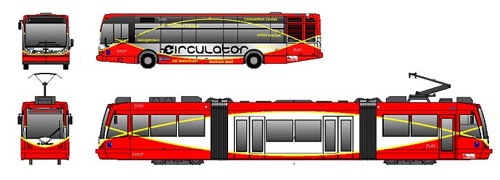
DC Circulator and DC Streetcar, to scale. These are not the same thing.
First, what’s not an inherent difference: The running way. Both streetcars and buses can, should, and do operate in both dedicated lanes and in mixed traffic with cars. When and where they do so can make a huge difference to a line’s effectiveness, but that decision is not dependent on the vehicle. The point of this list is to compare the modes when all other things are equal.
Streetcar advantages:
- Streetcars have greater capacity than buses.
Streetcars are bigger, longer, and can be combined into multi-car trains. They can carry many more passengers than any bus, even accordion buses. For corridors with ridership too high for buses to handle comfortably but not high enough to justify a subway, streetcars can be a good solution.
- Streetcars can be more affordable than buses over the long term.
While it’s true that streetcars cost more to build up front, that cost can be offset by operational savings year-to year, if the line carries enough passengers. Streetcars’ higher capacity means if there are lots of riders on a route, you can move them with fewer vehicles. Fewer vehicles means more efficient use of fuel and fewer (unionized and pensioned) drivers to pay. Streetcar vehicles themselves are also sturdier than buses, and last decades longer. In the long term, streetcars can be more affordable on very high ridership routes.
- Streetcar tracks reassure riders they’re on the right route.
In any big city, buses are confusing. There are so many crisscrossing routes that buses are intimidating and difficult to understand. For example, DC’S 16th Street has no fewer than 5 different routes, with two of them labelled identically as the S2 despite different destinations. New users are turned off because they don’t want to accidentally get on the wrong bus and end up far from their real destination. Since streetcars have to stay on their tracks, streetcars reassure riders their vehicle will go where they want it to go.
- Streetcars stand out.
The fact that streetcars are expensive to build means cities can’t realistically put them on every route. The size of any streetcar system is therefore inherently limited to only the more important routes (though how a city defines “important” may vary). This provides a convenient proxy for people to know where the best transit routes are, since most people don’t memorize their entire region’s incomprehensible jumble of bus routes. Instead of that jumble, streetcars provide a simple system map that’s easy to memorize. Meanwhile, trains are also civic icons. Tourists visit them, photograph them, and send postcards featuring them, all of which enhances a city’s brand. It’s true that frequent route networks and unique branding can bring some of these same benefits to buses, but streetcars are more powerful and noticeable symbols.
- Streetcars are more comfortable to ride than buses.
Any vehicle running on large tires over asphalt will sometimes be a bumpy ride, especially if the pavement is in less than perfect condition. Gliding along a rail is inherently smoother, making for a vastly more comfortable ride. This issue isn’t often discussed in newspaper articles, and rail opponents like to pretend it’s not a big deal, but it matters. And it’s not strictly a luxury issue, there’s a practical benefit: A smoother ride means passengers are more willing to stand, allowing for more open railcar interiors that maximize capacity.
- Streetcars are economic development magnets.
The presence of rail transit nearby is one of the best incentives for economic development in the world. Metro stations radically remade large swaths of the DC area, and streetcars can do the same (have done the same, in places like Portland and Toronto). Developers rarely base decisions around bus lines, but routinely follow rail investments with real estate ones. In fact, the additional taxes generated by rail-oriented development is often used to repay the initial capital investment of rail lines.
- Streetcars are quieter and cleaner than buses.
Because they run on electricity, streetcars are very quiet and emit no vehicle exhaust. While it’s true that electric trolleybuses exist, they are almost never used in the US because of BRT creep, and no new US city has introduced them in generations. This isn’t a truly inherent difference, and it may disappear as wireless electric buses proliferate. But for the time being it’s a legitimate difference.
- Streetcars are sometimes faster than buses.
Most streetcars have at least 3 doors, and many models have 4 or more. That means passengers at stations can load and unload faster, meaning streetcars can spend more time actually moving, and less time dwelling at stations waiting for passengers. Thus, when streetcars are not held up by other traffic, they’re faster than buses.
- Streetcars attract more riders than buses.
For all these reasons, people who would never consider riding a bus will ride a streetcar. Operational details trump all else, but when every other detail is equal, rail attracts more riders.
Of course, buses are useful tools too, and are the right choice in many (in fact most) situations. Buses must be a major part of every city’s transit network, including both local and rapid bus routes. But buses are demonstrably different than streetcars. They have different characteristics, accomplish different goals, and are more appropriate in different places.
Bus advantages:
- Buses are usually cheaper.
Buses don’t require the huge initial construction cost of streetcars, and except on the highest-ridership routes buses are generally cheaper to operate. This fact alone means buses are the right choice for most routes.
- Buses can put more service in more places.
Since buses are generally cheaper, a city can provide good transit service on several routes, going to several destinations, for the same cost as comparably-frequent service on one streetcar line. This is why every city in America uses buses instead of streetcars for most of its routes, and only introduces streetcars at special locations.
- Buses are more flexible.
Streetcars must run on rails, which sets their routes in stone. That’s both a blessing and a curse. While it means riders will always know where a route goes, it also means branching routes are impractical, which limits how broad an area transit can cover. Buses give transit operators the ability to send some buses that start off on the same route to different locations, such as how DC’s S2 and S4 Metrobuses split near Silver Spring .
- Buses can skip ahead.
On any street with more than one traffic lane, buses can pull around obstacles and speed forward. Streetcars must wait for obstacles to clear, meaning buses in mixed traffic with cars are often faster than streetcars in similar mixed traffic. It also means express and limited-stop bus routes can operate on the same streets as routes that make all stops. Technically speaking this isn’t an inherent difference, since a streetcar line could be built with multiple parallel tracks and frequent crossovers, but practically speaking that never happens.
Average Rating: 4.9 out of 5 based on 288 user reviews.
May 25th, 2010 | Permalink
Tags: BRT, bus, featured post, streetcar, transportation
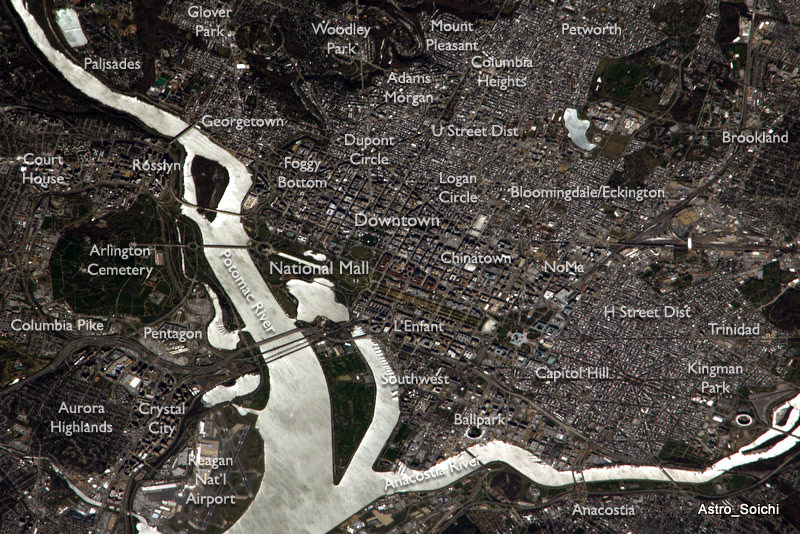
Twitter user @Astro_Soichi is a Japanese astronaut who takes amazing pictures of cities from 200 miles above the Earth’s surface while he orbits on board the International Space Station. He has photographed Washington at least two times.
That latter picture is such a good angle and so clear, I thought it would be fun to label it and make it a map of city neighborhoods.
Locals will probably already know this stuff, but maybe out-of-towners will find it interesting.
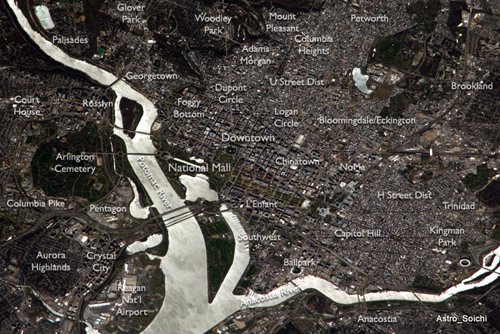
Aerial map of DC neighborhoods. Click to enlarge.
Original photo by Soichi Noguchi, from the ISS.
I’m going to add this to the list of features at upper right, because why not.
Average Rating: 4.9 out of 5 based on 276 user reviews.
May 3rd, 2010 | Permalink
Tags: featured post, site
|
Media


Site
About BeyondDC
Archive 2003-06
Contact
Category Tags:
Partners
|


