|
Special Features


Image Libraries


|
|
Blog
As 2017 gets underway, there are at least 23 protected bikeways in the Washington region, totaling about 8.5 miles. This map shows them all.
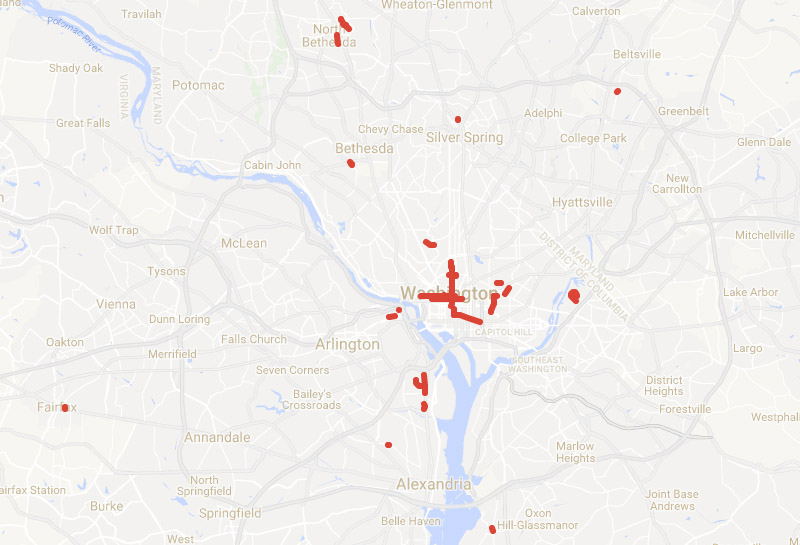
Protected bikeways in the Washington region.
Or at least, all those I know about. There are so many now that it's becoming hard to keep track.
The 23 bikeways range from lengthy to minuscule. DC's 15th Street cycletrack is both the oldest in the region and, at about 1.6 miles, the longest. On the other end of the spectrum are microscopic sections of normal unprotected bike lane where a few plastic bollards add a tiny degree of separation for a short stretch. The smallest is at the corner of New Hampshire Avenue and U Street, where a mere 60 feet of lane is protected with curb and flexposts.
The District has by far the most mileage of protected bikeway, with about 7 miles and all of the five longest individual bike lanes. After DC, Arlington and Montgomery are in a virtual dead heat for second place, each hovering with almost exactly one mile of protected bikeway, spread across four separate locations in each county.
Prince George's, Alexandria, and Fairfax City each have tiny cycletracks, combining for one-quarter mile.
For the future, DC has grand plans for a vast cycletrack network, and more jurisdictions are beginning to work on their own. Expect this map to expand in coming years.
In the meantime, if you know of an existing protected bikeway that's not on this map, leave a comment to let us know.
Update: This post has been updated to reflect additional protected bikeway segments that were missing from the original map.
 Comment on this at the version cross-posted to Greater Greater Washington. Comment on this at the version cross-posted to Greater Greater Washington.
Average Rating: 4.8 out of 5 based on 289 user reviews.
January 3rd, 2017 | Permalink
Tags: bike, maps, transportation

Last year, when Virginia’s VRE commuter rail system opened a new extension to Spotyslvania, the agency completely redesigned its map. The new version follows a trend for VRE: Every iteration gets more and more like a subway diagram, and less like a true geographic map.

VRE’s system map over time. Original images by VRE, compilation by the author.
The new map is at least the third completely different version VRE has tried since its launch in the 1990s. The original map was purely geographic, and oh-so ’90s. The second map was a hybrid with simplified geography. The newest is a pure diagram, with equally-spaced station symbols and only the barest nods to geographic context.
It generally makes a lot of sense for transit agencies, and particularly rail providers, to use diagrams instead of geographic maps. Features like the Potomac River’s many inlets, or minor curves on the rail lines, aren’t information that riders need to know, but they clutter the original map, making it hard to discern the information that does matter. On the other hand, it’s useful to know that the Fredericksburg line roughly parallels I-95 and that the Manassas line roughly parallels I-66.
Cameron Booth, the internet’s foremost expert on transit maps and author of TransitMap.net, reviewed VRE’s new map in December, calling it a “solid” but “unremarkable” effort.
Across the river in Maryland, the MARC commuter rail map remains completely geographic.
Comment on this at the version cross-posted to Greater Greater Washington.
Average Rating: 4.6 out of 5 based on 299 user reviews.
August 26th, 2016 | Permalink
Tags: commuterrail, maps, transportation
These maps show nearly every retail storefront in central DC compared to those in New York, Detroit, and other cities. Since retail streets are usually the most lively streets in a city, the maps offer a nice proxy illustration of urban vitality.

Images by City Observatory.
These maps are from City Observatory’s Storefront Index report, and are part of a series of 51 such maps of the largest US metro areas.
In general, the more red dots you see in a small area, the more lively that part of town will be. More stores, after all, mean more destinations for people to visit.
Here’s the DC map in greater detail:

Image by City Observatory.
You can easily see retail streets like U Street and H Street, and bigger clusters like Georgetown and Dupont Circle. On the other hand, primarily residential neighborhoods are mostly blank.
Unfortunately the data clearly isn’t perfect: The retail complex in Columbia Heights seems to be missing, as are the giant gift shops in the Smithsonian museums, and some neighborhood corner stores.
Still, the maps are an instructive illustration of urban vitality in general. You can see patterns here, and those patterns are real.
Zooming out to the regional scale, downtown areas outside the District like Bethesda, Silver Spring, and Alexandria become prominent.

Bethesda and Silver Spring are the clusters at the top. Alexandria is at the bottom. Image by City Observatory.
Compared to other US cities, DC looks decently lively. The country’s dense, transit-oriented cities like San Franicsco and Boston fare well (New York is a crazy outlier), while economically disadvantaged cities like Detroit and sparser more suburban-style ones like Raleigh show fewer stores, indicating less urban liveliness.
Of course, retail storefronts are a simplistic way to look at this. New York’s streets have a lot of stores because New York is tremendously dense, so there are lots of customers to support them. On the other hand Tysons Corner has a lot of stores because it’s a big suburban mall that people drive to from miles around.
Even suburban malls offer a sort of liveliness, however. So while these maps may say little about walkability, they are a good proxy for liveliness.
Comment on this at the version cross-posted to Greater Greater Washington.
Average Rating: 4.9 out of 5 based on 225 user reviews.
April 26th, 2016 | Permalink
Tags: maps
In 1912 Baltimore’s city leaders hoped to annex this large chunk of Baltimore County. Had that happened, the city limits would have extended from just shy of downtown Towson to just shy of Ellicott City.

Image from the State of Maryland.
Baltimore annexed big chunks of land in three successive waves: One in 1817 that took the city as far as North Avenue, a second in 1888 up to about 40th Street, and a third in the early years of the 20th Century.
Like other US cities, Baltimore was expanding rapidly in the early 20th Century amidst a wave of streetcar-induced sprawl. Suburban areas lacked city services like sewers, parks, and police, so central cities often annexed surrounding land.
By about 1910, Baltimore was ready for another round of annexation. Exactly how much land the city should annex became a major hot-button issue of the day, with proposals ranging from no expansion to the aggressive, far-ranging one pictured above.
In 1918 a compromise plan eventually won out, settling Baltimore’s boundaries at their current extents.
By the time America’s post-World War II suburbanization boom happened, the national mood had shifted against central cities. A 1948 amendment to Maryland’s state constitution outlawed any further expansion of Baltimore city, and thus the borders haven’t changed since.
Comment on this at the version cross-posted to Greater Greater Washington.
Average Rating: 4.8 out of 5 based on 283 user reviews.
March 3rd, 2016 | Permalink
Tags: government, history, maps
Over 20% of commuters in Bloomingdale, Mount Pleasant, and Petworth get to work each day primarily using a bicycle. That doesn’t even include people who use bikes to reach Metro.
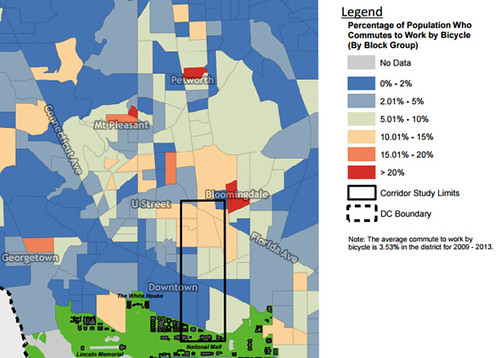
Bike mode share in central DC. Image from DDOT.
This fascinating map is part of the background data DDOT is preparing to study a possible protected bikeway on or around 6th Street NW.
It shows how hugely popular bicycling can be as a mode of transportation, even in the United States. What’s more, this data actually undercounts bicycle commuters by quite a lot.
It’s originally from the US Census’ American Community Survey, which only counts the mode someone uses for the longest segment of their commute. People who bicycle a short distance to reach a Metro station, then ride Metro for the rest of their commute, count as transit riders rather than bicyclists.
Comment on this at the version cross-posted to Greater Greater Washington.
Average Rating: 4.5 out of 5 based on 241 user reviews.
February 8th, 2016 | Permalink
Tags: bike, maps, transportation
The number of urban areas in the world with a population over one million has exploded since 1950. This map shows just how extreme that explosion has been.

Image from KPMG.
On the map, you can see how in 1950 the world’s scant million-plus cities were heavily concentrated in western Europe, the northeastern United States, and Japan. Since then, not many new ones have popped up in those places, but the rest of the world has caught up big time.
By the 1980s, China, India, and southeast Asia are challenging the west’s dominance. By the turn of the millenium, the middle east and central Africa join the party. South America keeps up a slower but steady pace the whole time.
What jumps out to you?
Comment on this at the version cross-posted to Greater Greater Washington.
Average Rating: 5 out of 5 based on 299 user reviews.
December 29th, 2015 | Permalink
Tags: demographics, maps
This map shows the real-time location for every WMATA bus and train in the Washington region. It’s a cool way to see how much transit is out there, and where it’s running right this second.

Every WMATA bus and train. Image from TRAVIC.
The map is called TRAVIC and was produced by the University of Freiburg. The Washington map was made using using open data from WMATA.
Although the Washington map shows only WMATA transit, the same website includes maps for dozens of cities all over the world. You can compare what transit is like in diverse places, from Albuquerque to Paris.
 |
 |
| Left: Albuquerque. Right: Paris. Images from TRAVIC. |
I’ll be staring at this a long time.
Comment on this at the version cross-posted to Greater Greater Washington.
Average Rating: 4.4 out of 5 based on 246 user reviews.
October 21st, 2015 | Permalink
Tags: bus, maps, metrorail, transportation
Maryland’s MARC train and Virginia’s VRE are very similar regional rail systems. This map shows what they might look like as a single integrated regional network.

Map from Peter Dovak at Transit Oriented.
Although MARC and VRE are so similar, they operate totally independently of each other. Riders on one may not even be aware the other exists. This map would help solve that.
The two agencies will probably never merge, but it might someday be possible to integrate their operations to work more like a single system. MARC trains might run across the Potomac into Virginia, and VRE trains might one day continue north into Maryland. It would be difficult but possible.
In the meantime, this map from Peter Dovak at Transit Oriented is a nice unofficial first step. And it’s easier on the eyes than the current official MARC or VRE maps.
Comment on this at the version cross-posted to Greater Greater Washington.
Average Rating: 4.5 out of 5 based on 258 user reviews.
August 12th, 2015 | Permalink
Tags: commuterrail, maps, transportation
Washingtonians hoping to catch a bus in 1975 consulted this friendly-looking hand-drawn map. Charming as it may be, the map has no lines. Rather, designers wrote the name of each bus route over and over along its path through the city.
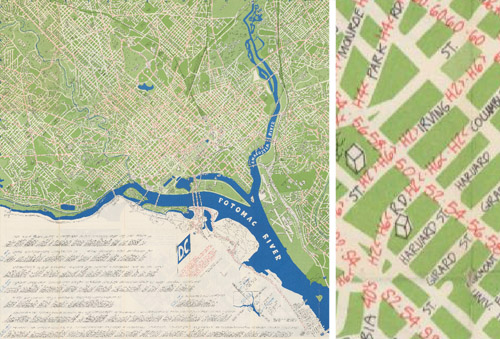
Image from DDOT.
Transit riders and cartography experts can’t fault the map designers too much. It was more challenging to illustrate detailed networks before the days of computers, and even in recent years some WMATA maps have been just as hard to follow.
Legibility aside, the map actually includes some very progressive elements considering its vintage. According to the legend, it only shows “all-day routes with frequent service, ” an incredibly useful idea that’s picked up a lot of steam in the past five years.
Other progressive elements shown on the map include bike paths, although the Mount Vernon and Rock Creek trails appear to be the only ones, and much of its text is translated into Spanish.
The map also includes a fun vignette of the Metrorail system, which had yet to open but was less than a year away.
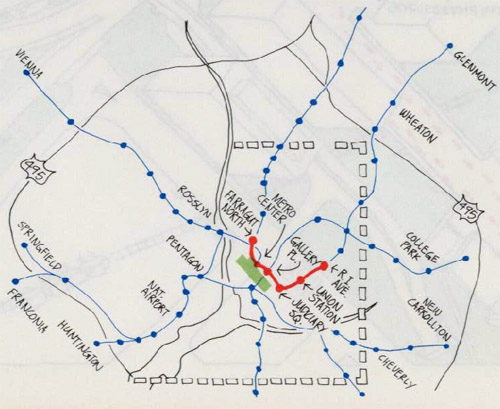
Image from DDOT.
On the other hand, some things never change. The legend for the Metrorail vignette notes Metro’s first phase was scheduled to open later in 1975. In actuality it didn’t open until 1976.
Finally, there are several other vignettes on the reverse side:
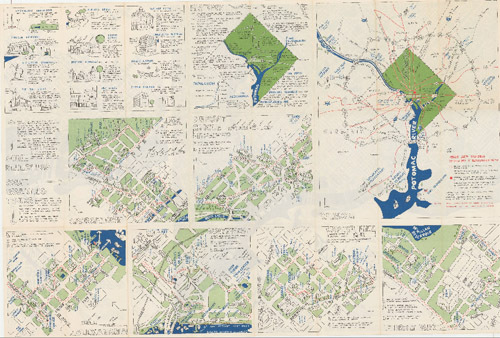
Image from DDOT.
Architecture firm John Wiebenson & Associates produced the map for the Bicentennial Commission of the District of Columbia.
Cross-posted at Greater Greater Washington.
Average Rating: 4.5 out of 5 based on 249 user reviews.
March 13th, 2015 | Permalink
Tags: bus, fun, history, maps, transportation
This incredibly cool map shows the footprints of every building in DC, Arlington and Alexandria, colored according to the predominant race living on that block.
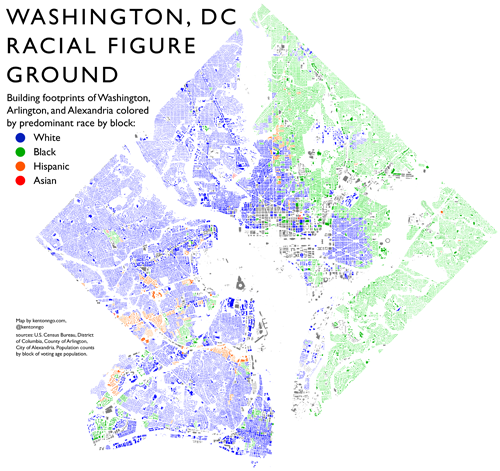
Map from Kenton Ngo at kentonngo.com.
By coloring blocks only according to the most populous race on each block, rather than showing everyone who lives there, this map sacrifices overall diversity to instead show simple majorities. That makes it less racially precise than the famous racial dot maps that have been floating around the internet in recent years.
But the dot maps are too cluttered to show buildings, so making that racial tradeoff allows this map to illustrate the built environment too. It’s a good way to show two disparate pieces of information at the same time.
What pops out as interesting to you?
Cross-posted at Greater Greater Washington.
Average Rating: 4.7 out of 5 based on 260 user reviews.
January 30th, 2015 | Permalink
Tags: maps
|
Media


Site
About BeyondDC
Archive 2003-06
Contact
Category Tags:
Partners
|


