|
Special Features


Image Libraries


|
|
Blog
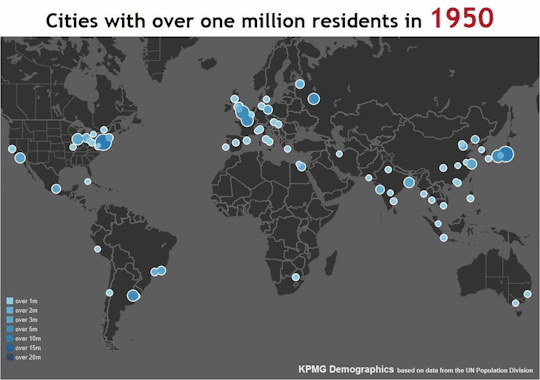
The number of urban areas in the world with a population over one million has exploded since 1950. This map shows just how extreme that explosion has been.

Image from KPMG.
On the map, you can see how in 1950 the world’s scant million-plus cities were heavily concentrated in western Europe, the northeastern United States, and Japan. Since then, not many new ones have popped up in those places, but the rest of the world has caught up big time.
By the 1980s, China, India, and southeast Asia are challenging the west’s dominance. By the turn of the millenium, the middle east and central Africa join the party. South America keeps up a slower but steady pace the whole time.
What jumps out to you?
 Comment on this at the version cross-posted to Greater Greater Washington. Comment on this at the version cross-posted to Greater Greater Washington.
Average Rating: 4.9 out of 5 based on 247 user reviews.
December 29th, 2015 | Permalink
Tags: demographics, maps

DC’s population is rising overall. But amid that rise, hundreds of thousands of people have come or gone since the year 2000. Among those who have left, inadequate housing is by far the biggest single reason.
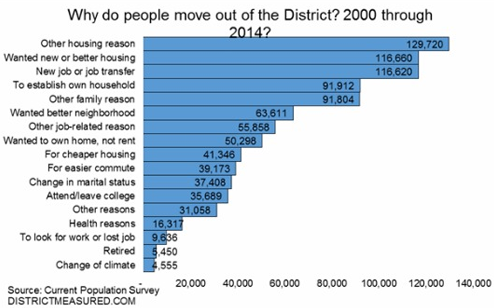
Image from the DC Office of Revenue Analysis.
According to survey data summarized in this report from the DC Office of Revenue Analysis, 937, 115 people have moved out of DC since the year 2000. 36% of them, 338, 000, cite a housing-related category as the reason why.
Some respondents say directly they needed cheaper housing. Others say they wanted newer housing, or better housing, or to own instead of rent. But the common denominator is that DC’s housing stock is inadequate, and that inadequacy is stifling the District’s population growth, as thousands who’d otherwise prefer to stay move away.
Every time some government agency restricts the housing market’s ability to meet DC’s tremendous demand, they make this problem worse. Every time the zoning commission downzones rowhouse neighborhoods, or every time a review board lowers a proposed building’s height, DC’s housing market becomes a little bit worse than necessary.
Over time as each restriction builds on the last, competition for the limited housing that’s available rises, prices shoot up, and the city’s less affluent populations are squeezed out.
It’s true that DC can never be all things to all people. For example, DC will never be able to supply as many large lot subdivisions as upper Montgomery County. But many types of housing that DC can absolutely supply are being unnaturally and unnecessarily restricted.
It’s a horrible situation.
What about schools?
DC’s inadequate schools are without a doubt also a major reason some people leave the District. According to Yesim Sayin Taylor of the Office of Revenue Analysis, we don’t know how many residents have left because of schools because the survey, which wasn’t designed specifically for DC, didn’t ask that question.
Presumably respondents who left because of schools cited something more general like “other family reason” or “wanted better neighborhood.”
Cross-posted at Greater Greater Washington.
Average Rating: 4.8 out of 5 based on 156 user reviews.
June 12th, 2015 | Permalink
Tags: demographics, development, economy, government, law, preservation
Using a consistent apples-to-apples counting method, Demographia ranked the world’s major urban areas by population. With nearly 38 million residents, Tokyo is by far the world’s largest, and is nearly twice the size of New York’s 21 million. DC clocks in with about 5 million, good for 77th in the world.

Tokyo is the world’s largest city. Photo from reddit user panic_switch.
Cities are hard to measure
It’s actually quite difficult to compare urban populations on any kind of consistent basis. City populations that follow municipal boundaries are arbitrary and inconsistent—some cities include their suburbs, while others do not.
Metropolitan areas are likewise difficult to nail down. In the US, the Census defines metro areas based on county boundaries, resulting in huge geographic disparities, especially in the west where some counties are the size of eastern states. Other countries use totally different methods.
Generally, the only way to build an apples-to-apples comparison is to map out the continuous built-up area of a region, and then measure the population within that area. With good enough data and consistent cut-off points, meaningful comparisons are possible. That’s called an urban area, and enough countries publish data on them that it’s possible to build a reasonably consistent world list.
Demographia did the leg work of stapling together government population data from countries around the world to build this list. Demographia is owned by famous sprawl proponent Wendell Cox, and pushes a generally pro-car/anti-transit ideology. But numbers are numbers, and these are interesting numbers.
The ranking
Demographia’s complete list covers every urban area in the world with a population above 500, 000. It’s about 1, 000 cities long.
Tokyo tops the list with almost 38 million people. Jakarta is second with about 30 million. Delhi, Manila, and Seoul round out the top five.
New York has 21 million and is the largest urban area outside of Asia, good for 9th worldwide. Los Angeles has 15 million and is 18th. Paris is 29th. London is 32nd.
In Maryland and Virginia, Baltimore is 206th with 2.3 million, Norfolk/Virginia Beach is 336th with 1.5 million, and Richmond is 485th with about 1 million.
What surprises you? What stands out? Click over to the GGW comments, and let us know.
Cross-posted at Greater Greater Washington.
Average Rating: 4.9 out of 5 based on 287 user reviews.
April 20th, 2015 | Permalink
Tags: demographics
This is a world population cartogram, a false-geography map that resizes countries according to their population. It’s an interesting way to view the world, and compared to common projections perhaps more accurate, in its own way.
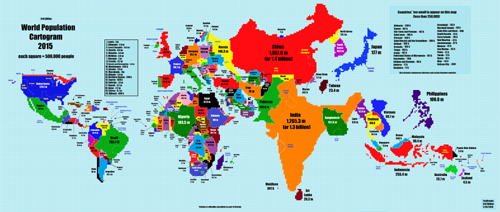
Map from Reddit user TeaDranks.
The United States is the world’s fourth largest country by land area, and third largest by population, so it’s not particularly distorted compared to geographic projections. But many other countries are.
China (1.4 billion) and India (1.3 billion) visually dominate, being by far the world’s two most populous countries. Others that stand out with seemingly oversized populations are Nigeria, Bangladesh, Japan, and the Philippines.
On the other end of the spectrum, the world’s two largest countries by land area are much reduced. Russia’s population of 146 million is still good enough for 9th highest globally, but that appears unimpressive against its normally huge area. And Canada, the world’s second largest country but only its 37th most populous, is nothing but a tiny sliver.
What stands out to you?
Cross-posted at Greater Greater Washington.
Average Rating: 4.8 out of 5 based on 203 user reviews.
January 26th, 2015 | Permalink
Tags: demographics, fun, maps
Pop quiz: Can you name the 5 Metro stations that have the highest number of households within a half-mile walk? Here’s a hint: More riders walk to those 5 stations each morning than to just about any others in the system.
It’s not a coincidence. According to WMATA’s PlanItMetro blog, “the more people can walk to transit, the more people do walk to transit — and data across Metrorail stations prove it.”
But there’s at least one surprise: 3 of the 5 stations with the most households nearby are in Maryland or Virginia, not the District.
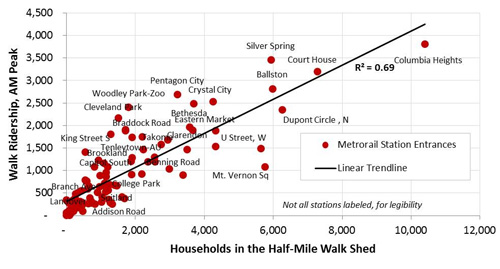
Households and walk ridership per Metro station. Image by WMATA.
Columbia Heights has by far the most households within walking distance. That makes sense. It’s one of DC’s densest neighborhoods, and the Metro station is right near its center.
But the number two most household-rich Metro station is Arlington’s Court House. Others in the top 5 are Ballston, Silver Spring, and Dupont Circle.
All 5 are among the 10 stations with the most riders who walk to the station each morning. The rest of the top 10 walking stations are Woodley Park, Cleveland Park, Pentagon City, Crystal City, and Bethesda.
More riders may be walking to jobs from the downtown stations, or from Rosslyn, but those are the destinations, where riders in the morning are getting off. The origin stations are the more residential ones.
All in all, Metro’s stations fit neatly along a trendline that shows a strong correlation between more households nearby and more riders arriving to stations by foot.
Even the outliers tell a story. U Street and Mount Vernon Square have the 6th and 7th highest number of households nearby, but they under perform on walking Metro ridership. One might speculate that Mount Vernon Square is so close to so many offices that more people simply walk. U Street is a little farther away, but it’s still close enough to downtown that buses and bicycles may be better options for a large portion of riders.
What else pops out as interesting?
Cross-posted at Greater Greater Washington.
Average Rating: 4.9 out of 5 based on 251 user reviews.
August 13th, 2014 | Permalink
Tags: demographics, land use, metrorail, transportation
|

Downtown DC. |
According to a US Census report, the District of Columbia’s daytime population, including commuters, swells to over 1, 000, 000. The difference between DC’s day and night populations is second greatest in the US.
The report dates from 2010 so the numbers are surely a bit different today. With DC’s (then) nighttime residential population of 584, 400, its 1, 046, 036 daytime population represents a 79% increase. Among US counties, only New York County (Manhattan) has a larger percentage increase.
Arlington looks much the same. Its 26% increase in daytime population is 13th largest nationally. That’s higher than San Francisco on the list.
At the other end of the spectrum, two DC suburbs top the list of places with decreased daytime population. Dale City and Centreville in Northern Virginia both drop by over 40%, making them America’s ultimate bedroom communities. Montgomery County’s Germantown is Maryland’s highest entrant, and clocks in at #20 with a decrease of 31%.
Part of the explanation for this is simply where boundaries are drawn. For example, even though Houston has a large downtown with many commuters, it doesn’t appear on the increased daytime population list because the City of Houston annexed so many of its suburbs that more of its commuters still technically live within the city limits. Likewise, Houston’s Harris County is gigantic and more or less envelopes the entire metropolis, so there’s little difference at the county level either.
Geographically smaller jurisdictions in large metropolitan areas are disproportionately more likely to show up in this data. So it’s not a great comparison of commuting patterns across different metropolitan regions. But it’s nonetheless interesting to know.
Cross-posted at Greater Greater Washington.
Average Rating: 4.7 out of 5 based on 299 user reviews.
May 16th, 2014 | Permalink
Tags: demographics
The latest future population projections forecast that by 2040 the District of Columbia will have a population of 883, 600. That would far eclipse the historic high of 802, 178, from the 1950 census.

Projected population increase from 2010 to 2040, in thousands. Image by COG.
Despite that growth, DC would still rank as only the 4th most populous jurisdiction in the region, behind Fairfax, Montgomery, and Prince George’s. But the next 26 years could narrow that gap considerably. Demographers project that only Fairfax will add more people than DC. Prince George’s will add fewer than half as many.
The forecasts come from the Metropolitan Washington Council of Governments (COG), which is sort of a United Nations for local governments in the DC region.
COG’s forecast report has a treasure trove of fascinating demographic info, not only about population, but also jobs and households. For example, by 2040 COG’s demographers expect DC to have over 1 million jobs.
Of course, these are only projections. Nobody can predict the future with 100% accuracy. COG’s forecasts often fail to predict the biggest peaks during booms and lowest dips during busts. But all in all they’ve historically been reasonably accurate.
So get ready for more neighbors.
Cross-posted at Greater Greater Washington.
Average Rating: 4.8 out of 5 based on 165 user reviews.
April 17th, 2014 | Permalink
Tags: demographics
There are more than 300 million people living in the United States today, but America is such a huge country that we still have staggeringly vast areas that are completely devoid of humans. This map illustrates those places. Everything colored green is a census block with zero population.

Map by Nik Freeman of mapsbynik.com.
The eastern US is pretty well populated except for a few spots in mountains and swamps. But the west is a different story. It’s covered with enormous stretches of land that are simply empty.
And Alaska’s emptiness makes even the western contiguous states look densely populated. Those green areas near the Arctic Circle look bigger than most other states.

Map by Nik Freeman of mapsbynik.com.
Cross-posted at Greater Greater Washington.
Average Rating: 4.6 out of 5 based on 151 user reviews.
April 16th, 2014 | Permalink
Tags: demographics, land use, maps
The US Census’ newest county-level population estimates show that between 2012 and 2013, the District of Columbia population grew more than any other metro area county.
Loudoun County grew slightly faster by percentage. But even according to that measure, DC is 2nd.
| County |
2012
population |
2013
population |
Raw
growth |
Percent
growth |
| District of Columbia |
633, 427 |
646, 449 |
13, 022 |
2.1 |
| Loudoun VA |
337, 248 |
349, 679 |
12, 431 |
3.7 |
| Fairfax Co VA |
1, 118, 683 |
1, 130, 924 |
12, 241 |
1.1 |
| Montgomery MD |
1, 004, 476 |
1, 016, 677 |
12, 201 |
1.2 |
| Prince George’s MD |
881, 419 |
890, 081 |
8, 662 |
1.0 |
| Prince William VA |
430, 100 |
438, 580 |
8, 480 |
2.0 |
| Anne Arundel MD |
550, 175 |
555, 743 |
5, 568 |
1.0 |
| Baltimore Co MD |
817, 682 |
823, 015 |
5, 333 |
0.7 |
| Howard MD |
299, 356 |
304, 580 |
5, 224 |
1.7 |
| Arlington VA |
221, 275 |
224, 906 |
3, 631 |
1.6 |
| Stafford VA |
134, 251 |
136, 788 |
2, 537 |
1.9 |
| Charles MD |
150, 710 |
152, 864 |
2, 154 |
1.4 |
| Alexandria VA |
146, 839 |
148, 892 |
2, 053 |
1.4 |
| Frederick MD |
239, 520 |
241, 409 |
1, 889 |
0.8 |
| Spotsylvania VA |
125, 772 |
127, 348 |
1, 576 |
1.3 |
| Fauquier VA |
66, 526 |
67, 207 |
681 |
1.0 |
| Baltimore city MD |
622, 417 |
622, 104 |
-313 |
-0.1 |
Cross-posted at Greater Greater Washington.
Average Rating: 4.4 out of 5 based on 177 user reviews.
March 27th, 2014 | Permalink
Tags: demographics, The New America
|

DC population change graph.
Image from Google.
|
Ten years ago, DC Mayor Anthony Williams famously set a goal of attracting 100, 000 new DC residents within a decade. Pundits scoffed, but the latest population estimates show we made it closer than most imagined possible.
The official US Census population estimate for DC in 2003 was 563, 384. The latest estimate for 2013 is 646, 449. That’s an increase of 83, 065.
In 2003, DC’s population was still shrinking. It had been about 569, 000 in 2002, and 572, 000 in 2000. Young single people had started flocking to some parts of DC, but families leaving for the suburbs still outnumbered people moving in and being born. Halting the decline seemed possible, maybe even likely, but growing by 100, 000 people in a decade seemed outrageously optimistic.
And to be fair, we didn’t quite make it. 83, 000 isn’t 100, 000. But it’s awfully impressive, awfully close. Far more than just about anybody thought possible.
DC’s population peaked at 802, 178 in 1950, then declined for the next half century. If today’s impressive growth rate continues into the future, we’ll catch up and surpass the 1950 high sometime in the mid 2020s.
We’ll have to keep up impressive growth to meet Mayor Gray’s goal of 250, 000 new residents by 2032.
Cross-posted at Greater Greater Washington.
Average Rating: 4.5 out of 5 based on 256 user reviews.
December 31st, 2013 | Permalink
Tags: demographics
|
Media


Site
About BeyondDC
Archive 2003-06
Contact
Category Tags:
Partners
|


_of_the_United_States_and_Puerto_Rico, _Feb_2013.gif)