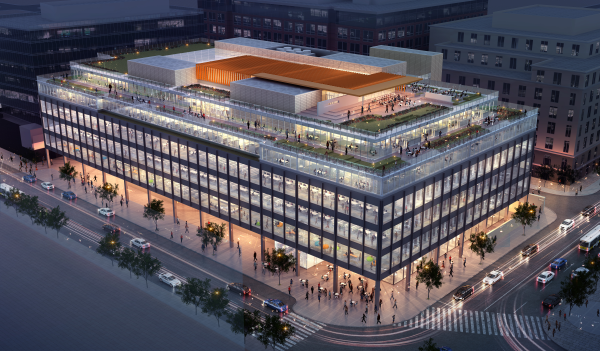
Mayor Gray’s proposed DC budget includes $100 million to renovate the MLK library. It’s in awful shape and needs to be either renovated or replaced, so it’s nice to see that become a priority.
But I’m very amused by the rendering of the proposed renovation. Isn’t it nice? The building is literally glowing. It’s a beacon of lightness amidst dark and dreary surroundings. Such simplicity! Such grace! Not at all like the ugly reality.
Granted, the point of the renovation is to make that ugly reality better. And the renovation will almost certainly result in a much better library, at least once you’re inside. But most of the visible changes are to the new floors added at the top of the building; the bottom 4 floors won’t look much different from today.
It’s worth remembering that renderings are intended to present buildings as nicely as possible. It’s also worth remembering that the scale of details necessary to make a 200 foot long building interesting while you’re walking beside it are dramatically different from the scale of details necessary to make a 6 inch rendering look clean.
Rendering of proposed MLK renovation. Perfectly fine thing to do, but it’s not going to be this pretty.
Average Rating: 4.8 out of 5 based on 155 user reviews.
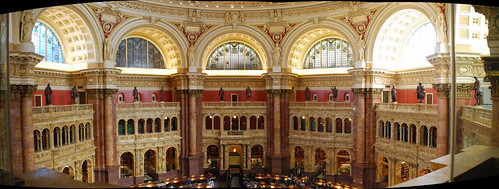
About 200 people have voted so far in the poll asking what is DC’s most beautiful room, and the traditional answer is the clear winner. The Library of Congress’ main reading room garnered a clear plurality, with 30% of all votes.
Three other rooms had large a percentage of the vote. The National Building Museum’s great hall was 2nd with 19%, the Library of Congress’ great hall was 3rd with 17%, and Union Station was 4th with 14%.
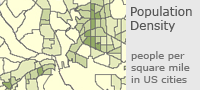
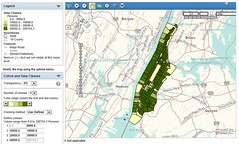
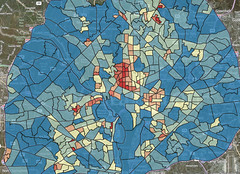
Last week’s post about census tract density in the DC area showed which neighborhoods inside the Beltway are densest. Now let’s look at the densest spots in the core areas of other large cities.
Urban areas are defined by the US Census as geographically connected areas with a population density of at least 1, 000 people per square mile (ppsm). The standard provides a uniform definition of “city, ” more useful for national comparisons than political boundaries. These maps show the central county in each of America’s 20 largest urban areas, in order beginning with the largest.
1. New York: America’s biggest city breaks the scale. While others on this list might have a few neighborhoods in the top density category, New York is covered end to end. It’s one of only 4 cities with tracts above 100, 000 ppsm. Its peak is 200, 000 ppsm.
2000
2010
2. Los Angeles: Despite its reputation for sprawl, LA compares favorably to the densest cities after New York. Its peak density of 94, 000 ppsm is well above DC’s.
Cool transit find of the week: This Capital Transit Company ticket from exactly 76 years ago, featuring robins and cherry blossoms.
For those keeping score at home, in 1937 it cost $1.25 for a week’s worth of unlimited streetcar and bus rides. Adjusted for inflation, that’s about $20. For comparison, WMATA weekly passes today go for $16 for a bus-only pass, and a little under $60 for a rail pass.
According to the latest trailer, the upcoming Star Trek movie will have a number of scenes set in 23rd Century Earth cities, including at least London and San Francisco. The trailer itself includes several quick shots.
Average Rating: 4.5 out of 5 based on 257 user reviews.
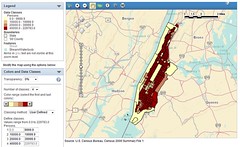
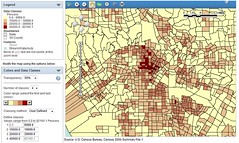
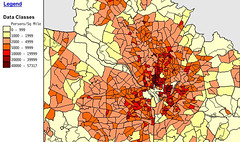
DC area density by census tract, in 2000 (top) and 2010 (bottom). Top image from US Census FactFinder. Bottom from Michael Rodriguez.
Density is a good thing for urbanism. More density means more shops and amenities nearby, better transit service, and shorter walks. But what qualifies as dense? Overall city density is often reported, but a more telling statistic is neighborhood density.
The two maps at right show DC neighborhood density at the time of the 2000 census (top) and 2010 census (bottom). I made the 2000 map using census.gov sometime after the 2000 census. Michael Rodriguez created the bottom map just recently. Unfortunately the two maps use different scales, but they’re still informative.
In 2000 the densest census tract in the DC region was in northern Columbia Heights, between Spring Road and Newton Street. It had 57, 317 people per square mile (ppsm).
In 2010 that tract is up to 59, 209 ppsm, but that’s only good enough for 2nd place in DC, and 3rd regionally.
The densest tract is now southern Logan Circle, between Rhode Island and Massachusetts Avenues. It’s boomed and is now a whopping 67, 149 ppsm.
The rest of central Northwest, from Mount Pleasant down to Massachusetts Avenue, varies from around 30, 000-50, 000 ppsm. Capitol Hill is in the 20, 000-30, 000 ppsm range.
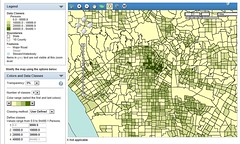
Meanwhile, in Alexandria, the tract at the corner of I-395 and Seminary Road is up to 59, 886 ppsm, 2nd densest in the region after Logan Circle. There hasn’t been any new development in that tract since 2000, but the suburban-style apartment towers in it may have fewer singles and more families, which could account for the increase. Crystal City is 45, 448 ppsm, and Ballston is 43, 788 ppsm.
Suburban Maryland’s densest tract is in Langley Park, at 49, 354 ppsm. Downtown Silver Spring is 34, 816 ppsm, and downtown Bethesda is around 11, 000 ppsm.
Average Rating: 4.6 out of 5 based on 264 user reviews.
Baltimore’s decades-long population decline has officially reversed. The city grew by about 1, 100 people last year. Congrats to Baltimore!
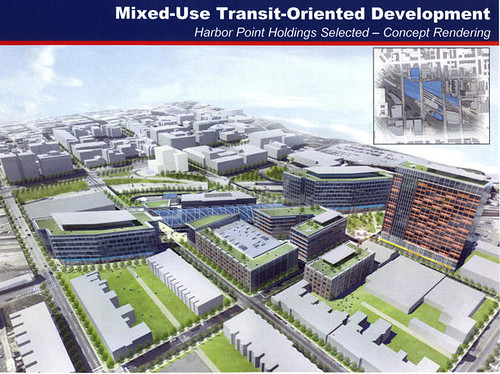
In more specific but also exciting news, Amtrak has adopted a new master plan for Baltimore’s Penn Station. It includes significant new development around the station, and a new canopy over the tracks that would dramatically improve the rider experience.
The plans are conceptual, and will have to go into greater detail before development can begin.
Concept plan for Penn Station. Image by Beatty Development.
Average Rating: 4.4 out of 5 based on 281 user reviews.
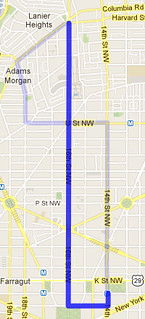
WMATA has settled on a route for its new 16th Street short turn bus. The new service will run every 13 minutes from Harvard Street to downtown DC, from 7:30-9:15 am. It will begin on March 25.
The new route is intended to relieve extreme overcrowding on the southern portion of 16th Street during the morning rush.
Previously, WMATA had only considered running the route as far north as Meridian Hill Park. Metro bus planner Jim Hamre says that had been based on the assumption that only 2 buses would be available. Since 3 are actually available, they can go a little further north and maintain frequent enough service to make a difference.
The route will not be called the S3, as originally thought. It will simply be called the “S2 Short.” For riders on 16th Street, it will look like any other S2.
Hamre announced the new plan at last night’s Dupont Circle ANC meeting. Commissioner Kishan Putta, who organized earlier community meetings to push for the the change, then introduced a resolution of support, which the ANC approved.


