Arlington Memorial Bridge opened in 1932, amidst the very depths of the Great Depression. It was a major event in Washington, which drew President Herbert Hoover, the first lady, and the vice president.
This vintage newsreel illustrates the excitement. The newsman is particularly enthusiastic that the bridge is wide enough for “4 cars to pass abreast.”
Video from British Pathe.
By the way, did you know the bridge doesn’t actually go to Arlington? Both sides are totally within the District of Columbia.
It’s a common misconception that the boundary between DC and Virginia is the middle of the Potomac. But in fact, the entire river is part of the District. If you are standing on the Virginia shore and step one foot into the river, you have technically crossed into DC.
The Memorial Bridge technically connects mainland DC and Columbia Island. The island is best known for the traffic circle on the far side of the bridge, often-confusing ramps on and off the George Washington Parkway, unsafe pedestrian/bicycle crossings, and Park Police who yell at drivers when they stop for pedestrians.
Since Columbia Island is fully within DC, so is Memorial Bridge. The actual Virginia boundary is along the much-shorter Esplanade Bridge, between Columbia Island and the Virginia mainland. This also means the GW Parkway and Mount Vernon Trail are partially within DC, since they run through Columbia Island.
DC/VA border. Image from Google.
Periodic protest organizer Adam Kokesh might benefit from consulting this map. He’s trying to lead a July 4th march with guns on DC, but since DC prohibits carrying guns around, including loaded ones, he’s now planning to march on the Memorial Bridge up to the District line and meet police there. He might have a hard time, since the District line doesn’t cross the Memorial Bridge.
When the Washington Monument topped out at 555 feet tall in 1884, it became the world’s tallest structure. Our champion status lasted only 5 years, until the Eiffel Tower put it to shame in 1889.
This vintage 1884 diagram shows the tallest buildings at that time, with Washington occupying the top.
From Cram’s Unrivaled Family Atlas of the World, Chicago IL. Lithograph color print.
Average Rating: 4.9 out of 5 based on 188 user reviews.
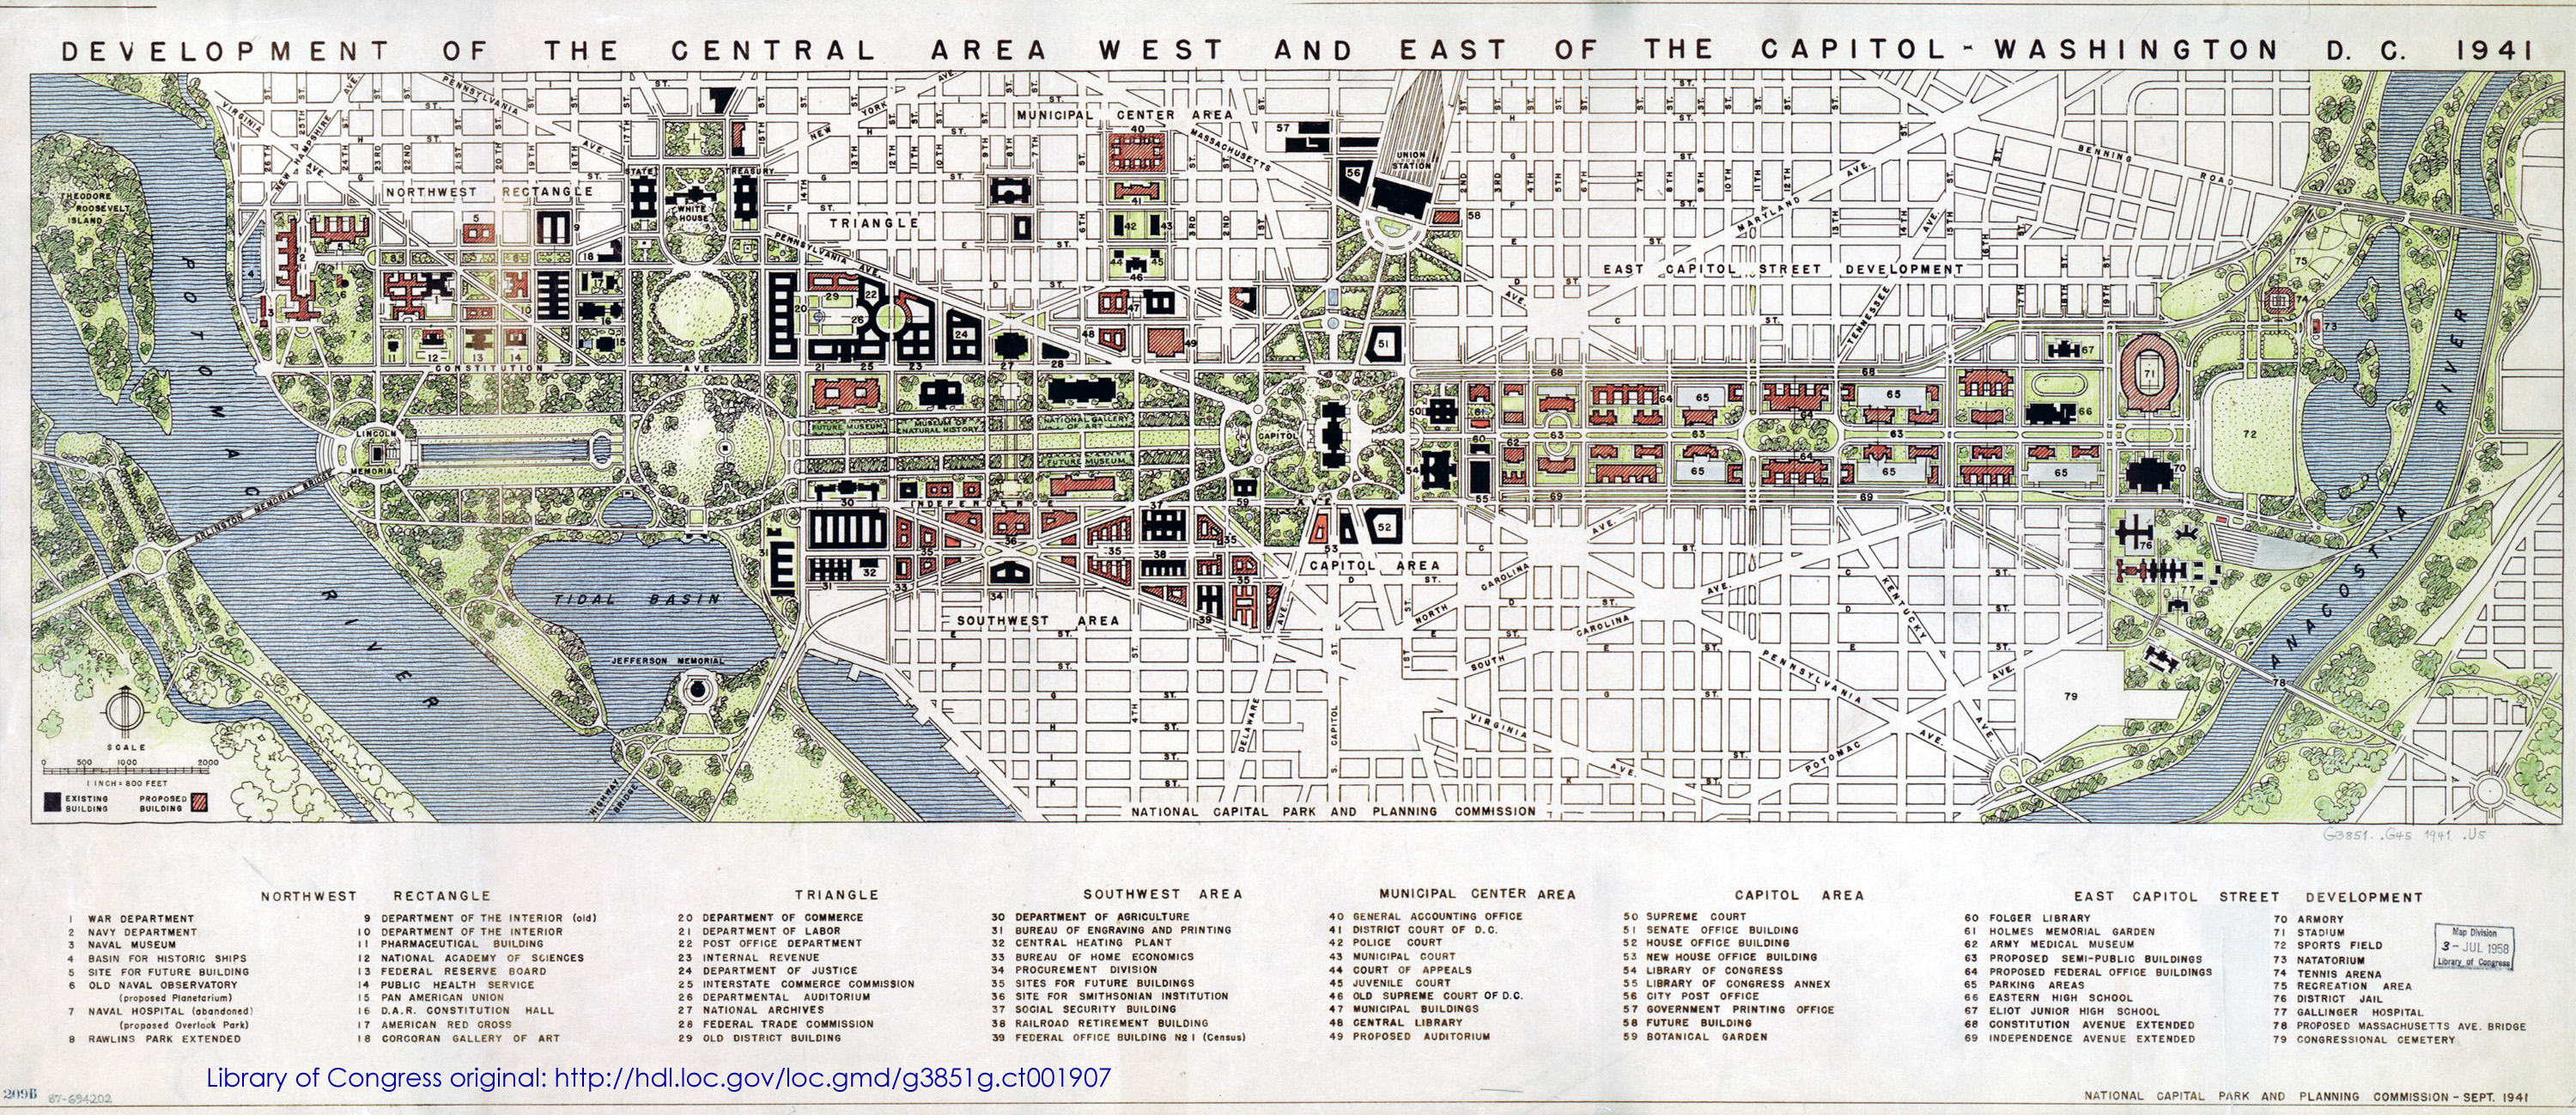
DC’s 1941 master plan is available through the Library of Congress. Published just months before Pearl Harbor, the plan is a fascinating look at the future pre-war planners envisioned.
The National Mall extends eastward to the bank of the Anacostia and dominates the plan. “Semi-public buildings, ” parking garages, and much more highway-like Constitution and Independence Avenues line the new Mall. On the other hand, Southwest retains its historic street grid, and isn’t cut off by I-395.
What else jumps out?
Image by National Capital Park and Planning Commission.
Last week’s post about census tract density in the DC area showed which neighborhoods inside the Beltway are densest. Now let’s look at the densest spots in the core areas of other large cities.
Urban areas are defined by the US Census as geographically connected areas with a population density of at least 1, 000 people per square mile (ppsm). The standard provides a uniform definition of “city, ” more useful for national comparisons than political boundaries. These maps show the central county in each of America’s 20 largest urban areas, in order beginning with the largest.
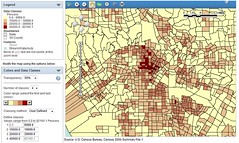
1. New York: America’s biggest city breaks the scale. While others on this list might have a few neighborhoods in the top density category, New York is covered end to end. It’s one of only 4 cities with tracts above 100, 000 ppsm. Its peak is 200, 000 ppsm.
2000
2010
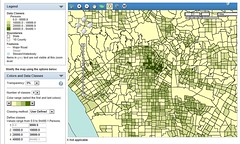
2. Los Angeles: Despite its reputation for sprawl, LA compares favorably to the densest cities after New York. Its peak density of 94, 000 ppsm is well above DC’s.
Cool transit find of the week: This Capital Transit Company ticket from exactly 76 years ago, featuring robins and cherry blossoms.
For those keeping score at home, in 1937 it cost $1.25 for a week’s worth of unlimited streetcar and bus rides. Adjusted for inflation, that’s about $20. For comparison, WMATA weekly passes today go for $16 for a bus-only pass, and a little under $60 for a rail pass.
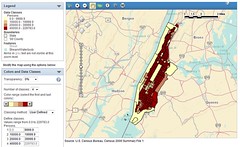
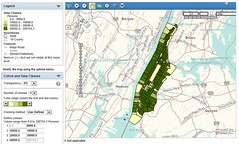
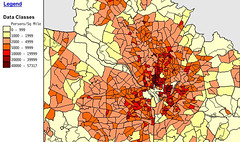
DC area density by census tract, in 2000 (top) and 2010 (bottom). Top image from US Census FactFinder. Bottom from Michael Rodriguez.
Density is a good thing for urbanism. More density means more shops and amenities nearby, better transit service, and shorter walks. But what qualifies as dense? Overall city density is often reported, but a more telling statistic is neighborhood density.
The two maps at right show DC neighborhood density at the time of the 2000 census (top) and 2010 census (bottom). I made the 2000 map using census.gov sometime after the 2000 census. Michael Rodriguez created the bottom map just recently. Unfortunately the two maps use different scales, but they’re still informative.
In 2000 the densest census tract in the DC region was in northern Columbia Heights, between Spring Road and Newton Street. It had 57, 317 people per square mile (ppsm).
In 2010 that tract is up to 59, 209 ppsm, but that’s only good enough for 2nd place in DC, and 3rd regionally.
The densest tract is now southern Logan Circle, between Rhode Island and Massachusetts Avenues. It’s boomed and is now a whopping 67, 149 ppsm.
The rest of central Northwest, from Mount Pleasant down to Massachusetts Avenue, varies from around 30, 000-50, 000 ppsm. Capitol Hill is in the 20, 000-30, 000 ppsm range.
Meanwhile, in Alexandria, the tract at the corner of I-395 and Seminary Road is up to 59, 886 ppsm, 2nd densest in the region after Logan Circle. There hasn’t been any new development in that tract since 2000, but the suburban-style apartment towers in it may have fewer singles and more families, which could account for the increase. Crystal City is 45, 448 ppsm, and Ballston is 43, 788 ppsm.
Suburban Maryland’s densest tract is in Langley Park, at 49, 354 ppsm. Downtown Silver Spring is 34, 816 ppsm, and downtown Bethesda is around 11, 000 ppsm.
Average Rating: 4.4 out of 5 based on 161 user reviews.
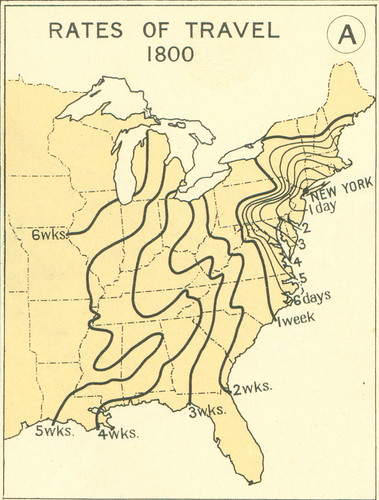
Railroads and the Making of Modern America has a really interesting series of maps up, illustrating how long it took to travel across the country at various times in American history.
In 1800 it took 4 days to get from DC to New York. By 1830 it took only 2, and by the 1850s it could be done in less than 1.
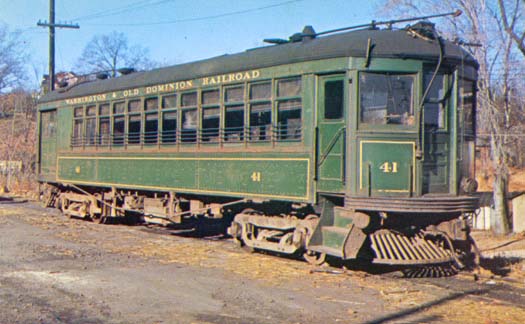
This map claims to show every local electric railway line that operated in the region between 1890 and 1962, regardless of who operated it or when it ran. That makes this much more comprehensive than DC Transit maps that only show one company’s lines, and only from a single year.
Some of the longer lines on this map are “interurbans, ” which were trolley vehicles that functioned more like commuter rail than central city streetcars, stopping less frequently and running on longer headways. Today we’d probably call them light rail. They’re on the map because no matter their route characteristics, they were basically electric trolleys. That includes Virginia’s well-known W&OD, which isn’t usually called a trolley line today.
The map first appeared on wikipedia and was created by the anonymous user “SDC”.
Average Rating: 4.7 out of 5 based on 298 user reviews.
Flickr user davidwilson1949 has a collection of over 100 historic transit pictures from the DC area, dating from the 1970s forward. Fun and fascinating stuff. Here are two of his images:
Articulated Metrobus, 1979.
Ride-On bus, 1979.
Average Rating: 4.5 out of 5 based on 206 user reviews.
From 1949 until 1962, DC Transit trolleys ran in a subway under Dupont Circle. Those subway tunnels are still there, boarded up and unused. I got a tour of the old tunnels yesterday, and detailed the trip with a set of pictures.
You can preview the pictures using the slideshow below, but the best way to see them is on flickr itself, where you’ll get a full description of each one. If you use flickr directly, you can navigate to subsequent pictures using the thumbnails on the right side of the page. If you look at each picture in order and read each description, you’ll pretty much be getting the same tour I got in person.
Average Rating: 5 out of 5 based on 270 user reviews.


 Cross-posted at Greater Greater Washington.


